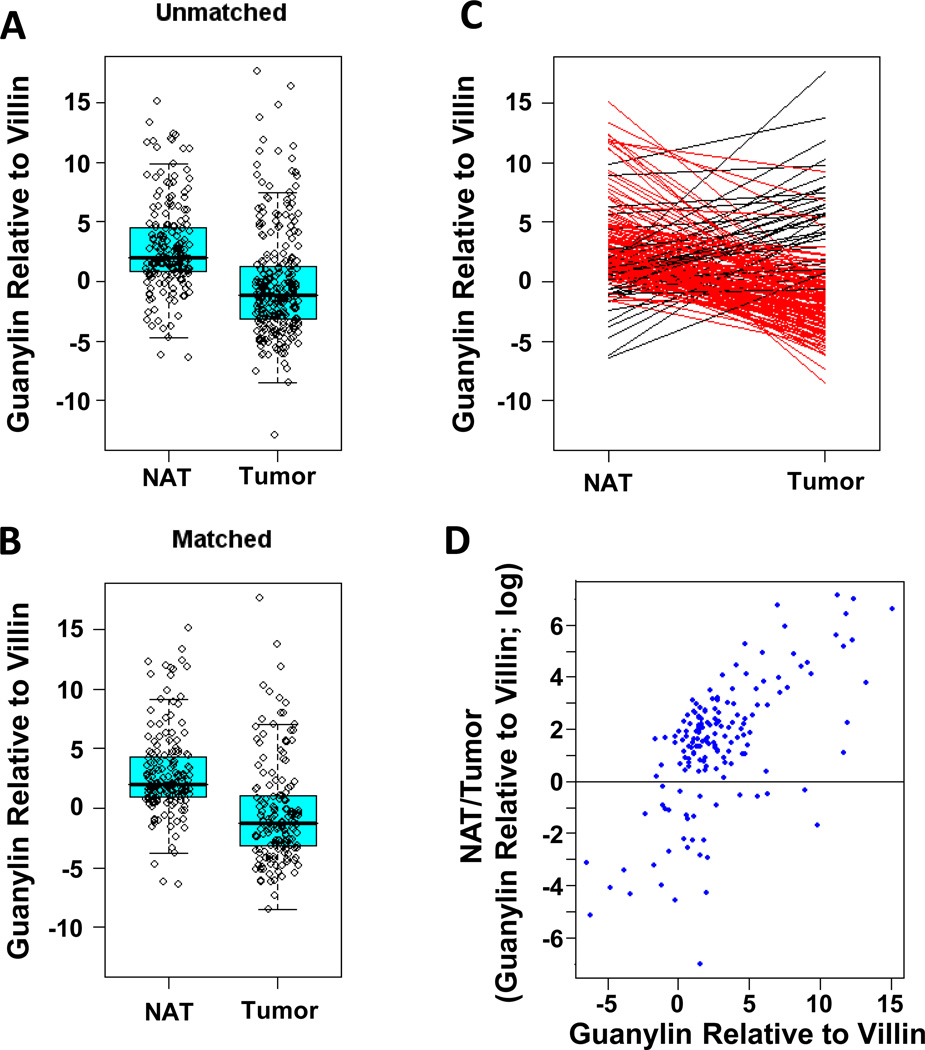
Figure 2. Guanylin mRNA expression in normal adjacent tissues (NAT) and tumors from the colorectum.
(A) Distribution of guanylin mRNA expression in all 188 NAT and 252 tumors. (B) Distribution of guanylin mRNA expression in 159 matched NAT and tumor specimens. (C) Change in guanylin mRNA expression in 159 tumors, compared to their matched NATs. Red lines connect NATs with adjacent tumor specimens with decreased guanylin mRNA expression. Black lines connect NATs with adjacent tumor specimens with increased guanylin mRNA expression. (D) Relationship between basal guanylin expression in 159 NAT (X axis) and loss of guanylin expression in associated tumors (NAT/tumor; Y axis). Tissues were obtained and processed, mRNA extracted, and guanylin mRNA expression quantified by RT-PCR analysis as described.

