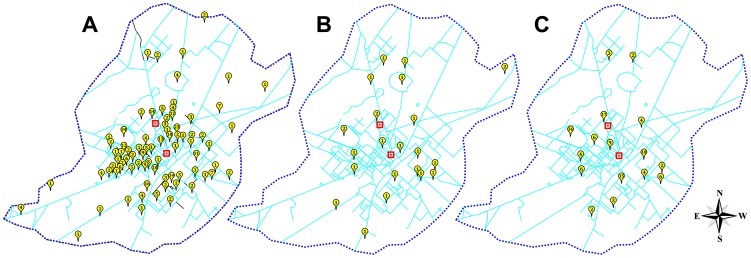
There is an error in the legend for Figure 2. Please see the complete, corrected Figure 2 here.
Figure 2. Hot spots for dengue infection in Faisalabad city.
The distribution of dengue cases reported from Faisalabad city. A) Map of Faisalabad city showing areas from which dengue cases were reported in 2011, B) in 2012 and C) during both years. Squared place marks represents location of medical centers in the city.
Table 2 has been corrected for improved readability. Please see the corrected Table 2 here.
Table 2. Characteristics Presented by Patients Suffering from Dengue Fever (DF) and Dengue Hemorrhagic Fever (DHF).
| Characteristics | DF (%) | DHF (%) | N | p value1 |
| Demographics | ||||
| Age [median (interquartile range)] | 30 (22) | 24.5 (17) | 299 | 0.05 |
| Gender | ||||
| Male | 184 (77) | 34 (56.7) | 299 | 0.03 |
| Female | 55 (23) | 26 (43.3) | ||
| Clinical Presentation | ||||
| Headache | 184 (77) | 46 (76.7) | 299 | >0.05 |
| Myalgia/arthralgia | 212 (88.7) | 49 (81.6) | 299 | 0.191 |
| Vomiting | 121 (50.6) | 35 (58.3) | 299 | 0.314 |
| Abdominal pain | 34 (14.2) | 21 (35) | 299 | 0.001 |
| Nausea | 36 (15.1) | 17 (28.3) | 299 | 0.023 |
| Rash | 16 (6.7) | 12 (20) | 299 | 0.005 |
| Diarrhea | 11 (4.6) | 5 (8.3) | 299 | 0.331 |
| Anorexia | 13 (5.4) | 9 (15) | 299 | 0.22 |
| Sore throat | 16 (6.7) | 6 (10) | 299 | 0.407 |
| Retro-orbital pain | 17 (7.1) | 9 (15) | 299 | 0.07 |
| Cough | 22 (9.2) | 7 (11.6) | 299 | 0.625 |
| Cold skin/clammy skin | 4 (1.7) | 5 (8.3) | 299 | 0.018 |
| Restlessness | 11 (4.6) | 7 (11.6) | 299 | 0.062 |
| Periorbital puffiness | 5 (2.1) | 5 (8.3) | 299 | 0.031 |
| Hemorrhages | ||||
| Epistaxis (Nose bleed) | 14 (5.9) | 15 (25) | 299 | <0.001 |
| Gingivitis (Gum Bleed) | 17 (7.1) | 11 (18.3) | 299 | 0.012 |
| Melena (blood in stool) | 9 (3.8) | 12 (20) | 299 | <0.001 |
| Hematemesis (vomiting blood) | 13 (5.4) | 8 (13.3) | 299 | 0.045 |
| Hematuria (blood in urine) | 5 (2.1) | 5 (8.3) | 299 | 0.031 |
| Petechiae (small spots) | 12 (5) | 7 (11.7) | 299 | 0.074 |
| Other* | 8 (3) | 7 (11.7) | 299 | 0.016 |
| Clinical Signs | ||||
| Temperature [median (SD)] | 37 (0.2) | 37.22 (1.1) | 0.108 | |
| Abdominal tenderness | 7 (2.9) | 8 (13.3) | 299 | 0.003 |
| Splenomegaly (Spleen enlargement) | 15 (6.3) | 14 (23.3) | 299 | <0.001 |
| Hepatomegaly (Liver enlargement) | 12 (5) | 18 (30) | 299 | <0.001 |
| Laboratory Findings | ||||
| Thrombocytopenia at presentation | 226 (96.2) | 57(95) | 295 | 0.715 |
| Low hemoglobin | 104 (44.1) | 43 (71.7) | 296 | <0.001 |
| Hematocrit level on admission [median (SD)] | 42.05 (8.3) | 36 (17.9) | 296 | <0.001 |
| Leukopenia | 172 (72.3) | 42 (70) | 298 | 0.749 |
| Increased ALT | 112/213 (52.6) | 23/31 (74.2) | 244 | 0.032 |
| Increased AST | 08/14 (57.1) | 05/05 (100) | 19 | 0.077 |
p-value was calculated by non-parametric (Mann-Whitney U) test for age, temperature, and hematocrit. The χ2-test was used for all other categorical variables; p value less than 0.05 was considered as significant.
*Menstrual bleed, Sub-conjunctival bleed, Ear Bleed, Hemoptysis, Purpura, Ecchymosis.
The “Cluster Map for Dengue Infection” subsection of the Materials and Methods is incorrect. The correct paragraph is: CorelDRAW 12 was used to build map of the Faisalabad city in which placemarks indicate areas from which dengue cases were reported. Numbers on the placemarks represent the frequency of dengue cases from the specified areas.
Reference
- 1. Raza FA, Rehman Su, Khalid R, Ahmad J, Ashraf S, et al. (2014) Demographic and Clinico-Epidemiological Features of Dengue Fever in Faisalabad, Pakistan. PLoS ONE 9(3): e89868 doi:10.1371/journal.pone.0089868 [DOI] [PMC free article] [PubMed] [Google Scholar]


