Figure 2.

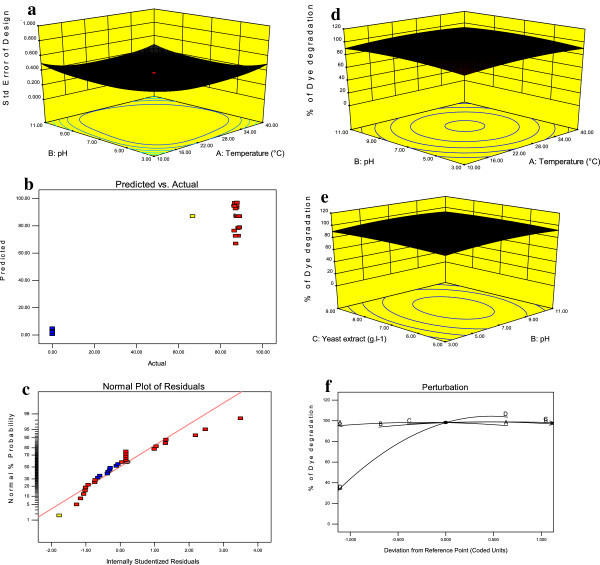
Effect of culture conditions on dye degradation (a) standard error plot for the response of dye degradation and laccase production, (b) predicted and actual response of the dye degradation by Hypocrea lixii , (c) Normal probability, (d) significant interactive effect of pH and temperature, (e) significant effect of the yeast extract and pH, (f) optimization of the dye degradation of perturbation plot.
