
Figure 2.
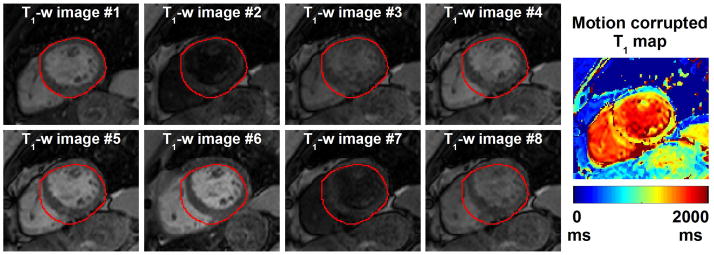
Example of motion corrupted T1-weighted image series. To facilitate visual motion assessment, the epicardial contour of the myocardium was drawn on the first T1-weighted image and is overlaid in all other images (red contours). Large drifting motion can be observed between the T1-weighted images which results in large artifacts, and a non-diagnostic T1 map.