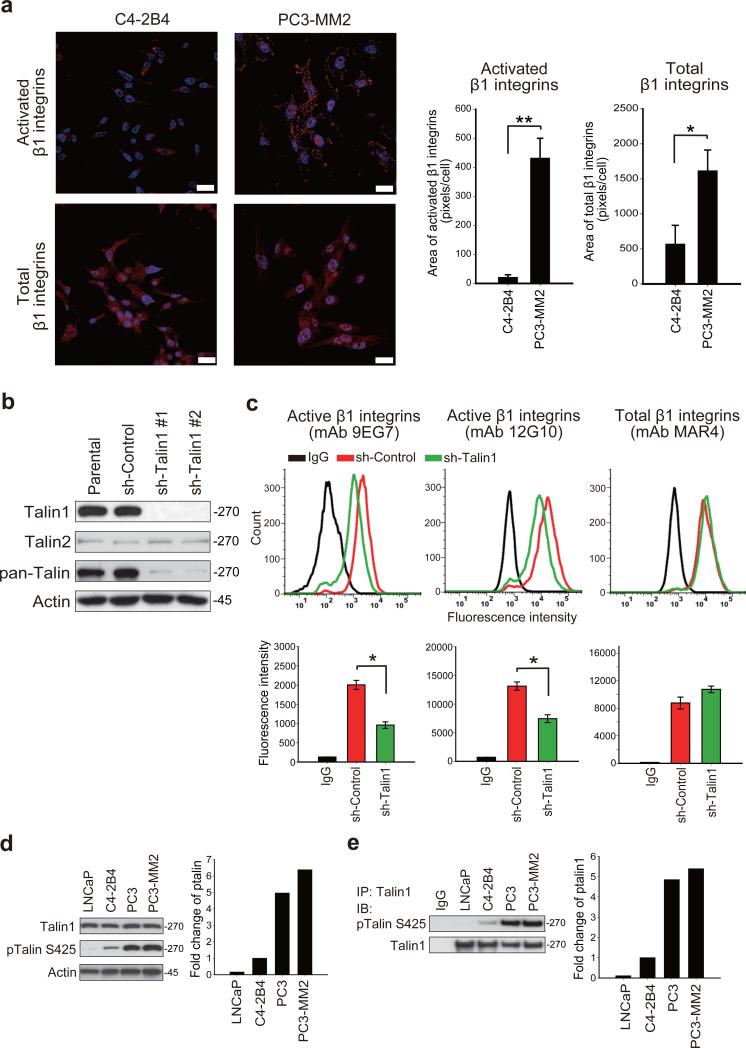
Figure 1.
Talin1 S425 phosphorylation correlates with β1 integrin activation in metastatic PCa cells. (a) Immunofluorescence staining of activated β1 integrins (top panels) using a conformation-specific antibody (mAb 12G10) and total β1 integrins (bottom panels). Nuclei were counterstained by Hoechst 33342. Scale bar represents 25 μm. Quantitation of immunofluorescence area is shown in the right panel. *P < 0.05 and **P < 0.001. (b) Silencing of talin1 in PC3-MM2 cells by shRNA expression. A non-targeting shRNA sequence was used as a sh-control. (c) Flow cytometric analysis of total and activated β1 integrins in talin1-silenced PC3-MM2 cells (top panels). Quantitation of fluorescence intensity is shown in the bottom panels. *P < 0.005. (d) Immunoblotting of total talin1 and talin S425 phosphorylation in PCa cell lines. (e) Immunoprecipitation of talin1 followed by immunoblotting of talin S425 phosphorylation in indicated PCa cells.

