
FIGURE 3.
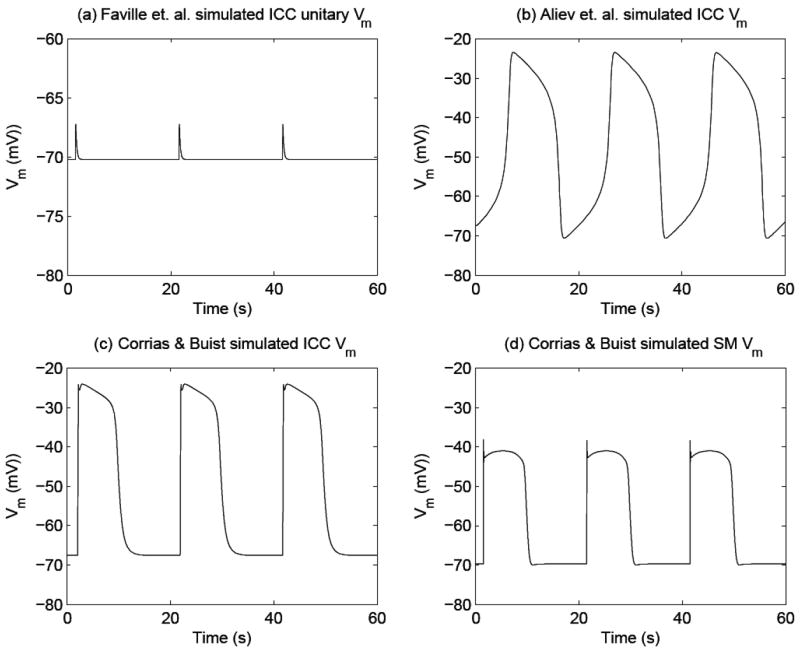
Simulated gastric electrical activity (GEA) using computer-based mathematical models. Shown in (a) is simulated unitary potentials (UPs) which are believed to generate pacemaker potentials in summation, using the Faville et al.2 ICC model. The simulated UPs contain an autonomous frequency of 3 cpm, amplitude of 3 mV, and resting Vm of 70 mV. Shown in (b) is the simulated membrane potential (Vm) of an ICC, which is known as the pacemaker potentials, using the Aliev et al.19 model. The simulated pacemaker potentials contain an autonomous frequency of 3 cpm. The peak and resting membrane potential (Vm) have to be scaled in order to match experimental data, as the Aliev model is a phenomenological model. Shown in (c) are simulated pacemaker potentials using the Corrias and Buist21 ICC model. The simulated pacemaker potential has an autonomous frequency of 3 cpm, an amplitude of 45 mV, and a resting Vm of -70 mV. Shown in (d) is the simulated Vm of canine gastric smooth muscle cells (SMCs), which is also known as slow waves, using the Corrias and Buist22 SMC model. This cell model requires a pacemaker potential as an input to depolarize the Vm (an output of the SMC model). The simulated slow wave has a frequency of 3 cpm, amplitude of 35 mV, and resting Vm of -70 mV.