
FIGURE 6.
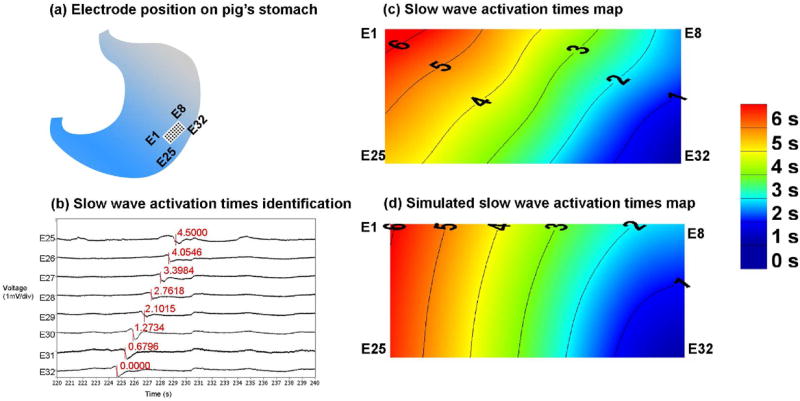
Illustration of gastric serosal recordings using a 32-channel electrode array (E1–E32), which was placed in the orientation on a porcine stomach as shown in (a). Shown in (b) are recorded extracellular traces corresponding to eight electrodes (out of 32) with slow wave activation times marked by the red vertical lines. The locations of the red lines were determined by the most negative deflection during a slow wave event. Also shown is (c) an activation times map corresponding to the signals in (b), the isochrones of activation times indicate that slow waves propagation was in the aboral direction (E32 towards E1). Shown in (d) is a simulated slow wave event with the activation times sampled over the same dimensions as the array of electrodes (a).The activation times and direction of the simulated slow waves (d) are in a reasonable agreement with the experimental recording (c).