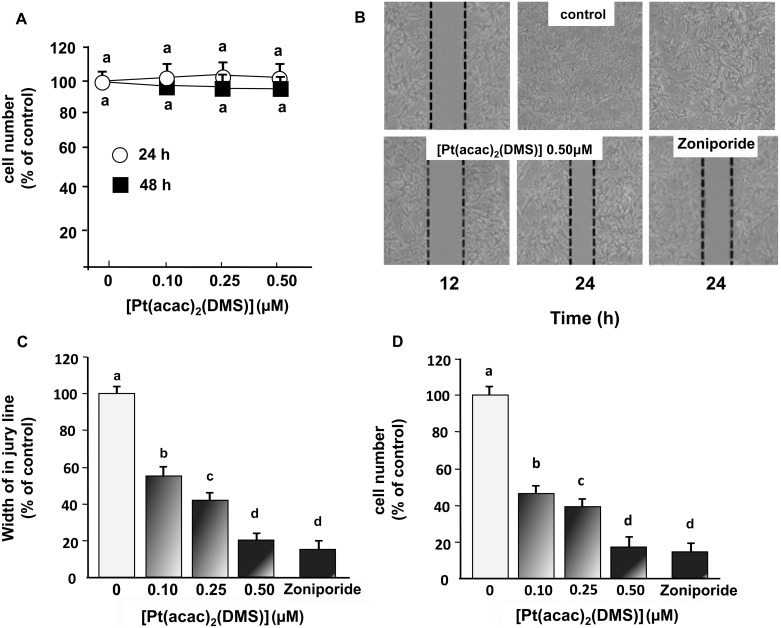
Figure 1. [Pt(acac)2(DMS)] inhibition of SH-SY5Y cell migration and invasion.
Cells were treated or not with increasing concentrations of [Pt(acac)2(DMS)] and for the indicated time intervals. (A) Viable cell numbers were assessed by SRB assay as described in Methods. (B) Differential cell migration rate was examined using wound closure assay. Cells were treated or not with [Pt(acac)2(DMS)] or with the Zoniporide (100 nM) and monitored by microscopy at the indicated times. (C) Differential migration rate was assessed by measuring the distance between wound edges after 24 h at indicated [Pt(acac)2(DMS)] concentrations in at last eight randomly chosen regions of four different experiments (means ± SD) normalized to 100% wound closure for control cells. (D) Cell invasion was measured using the transwell invasion assay system. The data are means ± SD of four different experiments and are presented as per cent of control. Statistical analysis was carried out using the ANOVA (n = 4): (A) P>0.05 for both “24 h” and “48 h”; (C, D) P<0.0001. Values with shared letters are not significantly different according to Bonferroni/Dunn post hoc tests.

