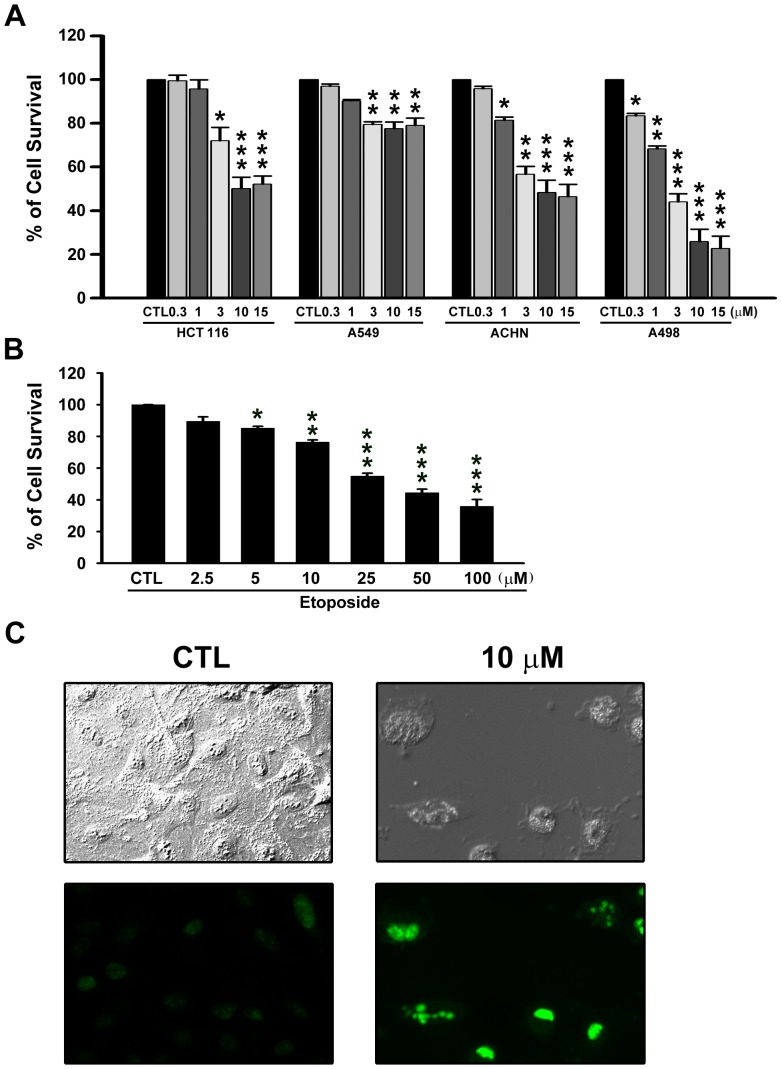
Figure 1. Effects of NPRL-Z-1 on cell viability in four human cancer cell lines.
(A) HCT 116, A549, ACHN, and A498 were treated with NRRL-Z-1 at various concentrations for 48 h and analyzed using the MTT assay. (B) A498 cells were treated with vehicle or etoposide at various concentrations for 48 h and analyzed using the MTT assay. (C) Fluorescence microscopy of untreated or NPRL-Z-1-treated A498 cells for 24 h followed by TUNEL staining (at 20× magnification). Data are expressed as the mean percentage of control ± S.D. of three independent experiments. * p<0.05,** p<0.01, and *** p<0.001 compared with the control group.

