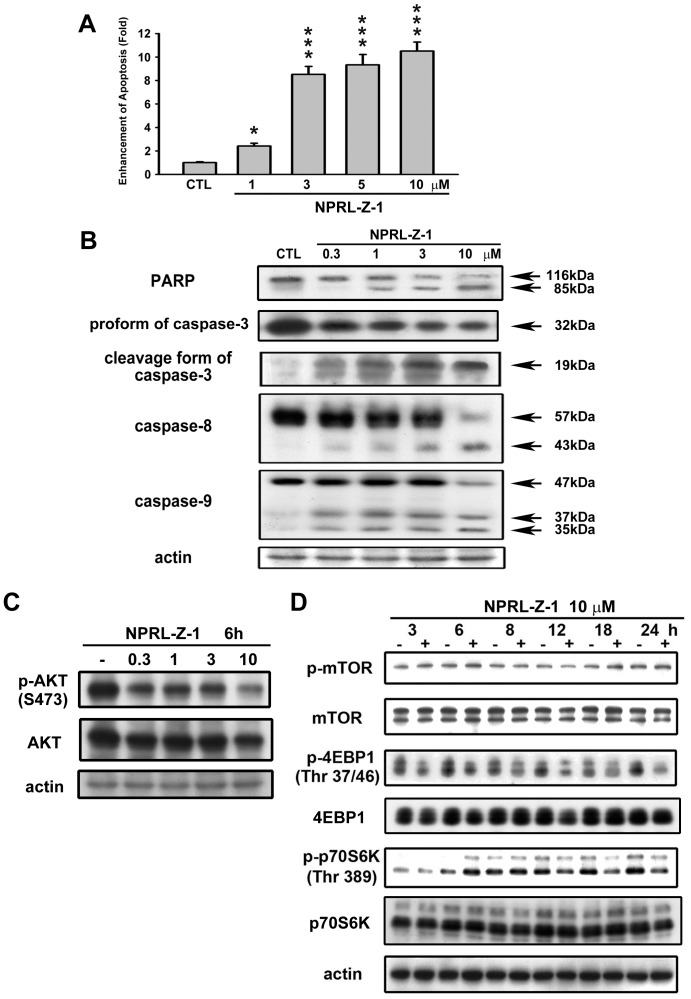
Figure 2. Effects of NPRL-Z-1 treatment on cell apoptosis induction and expression of apoptosis-related proteins in A498 cells.
(A) Cells were treated with DMSO or NPRL-Z-1 at various concentrations (1, 3, 5, and 10 µM) for 24 h. Formation of cytoplasmic DNA was quantitatively measured by cell death ELISAPLUS kit. Data are expressed as the mean percentage of control ± S.D. of three independent experiments. * P<0.05, and *** P<0.001 compared with the control group. A498 cells were incubated in the absence or presence of NPRL-Z-1 at various concentrations (0.3, 1, 3, and 10 µM) for 24 h (B) and 6 h (C), and cells were harvested and prepared for detection by Western blotting. (D) Cells were treated for indicated times, and the cell lysates were subjected to immunoblotting by using indicated antibodies.

