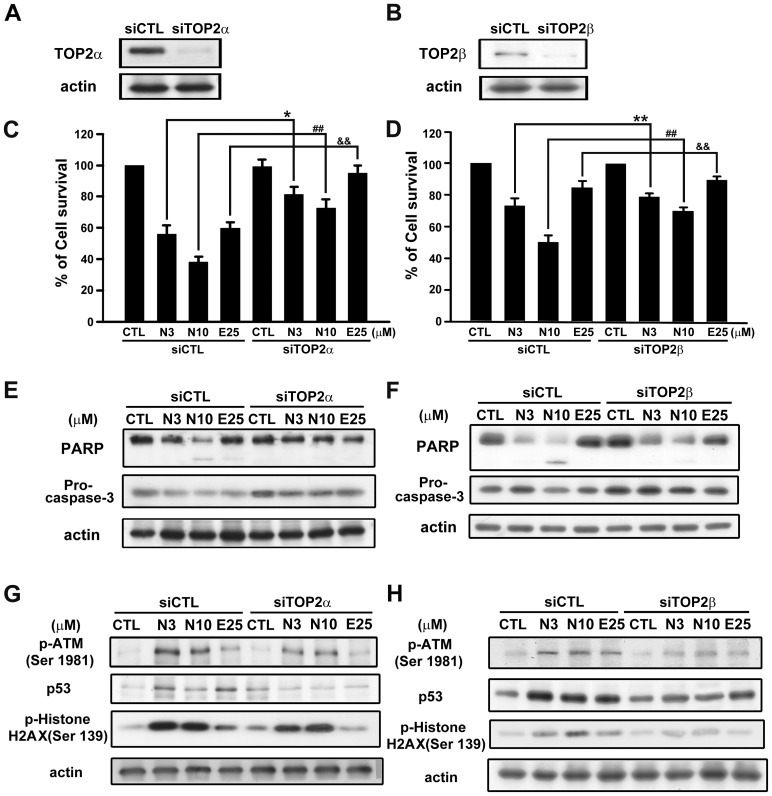
Figure 7. Effects of TOP2 in NPRL-Z-1-induced cell death and DNA damage signaling.
TOP2α or TOP2β siRNA was transfected to evaluate expression of TOP2α (A) and TOP2β (B), cell viability using the MTT assay (C and D), expression of apoptosis-related proteins (PARP and pro-caspase-3) (E and F) for 24 h, and DNA damage-related proteins (p-ATM, p53, and p-histone H2AX) (G and H) for 1 h in A498 cells. Data are expressed as the mean percentage of control ± S.D. of three independent experiments. *, & p<0.05, and **, ##, && p<0.01 compared with the treatment group. N3, N10 and E25 indicated as NPRL-Z-1 3 µM, 10 µM and etoposide 25 µM, respectively.

