
Figure 3. Exposure phase: Grand-average ERPs for in-tune (solid line) and mistuned (dashed line) target tones in the Strongly Metrical group (left) and Isochronous group (right).
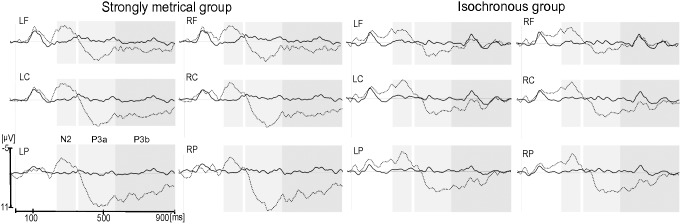
Each site represents the mean of the five electrodes included in the ROI (LF, left frontal; LC, left central; LP, left parietal; RF, right frontal; RC, right central; RP, right parietal). Grey rectangles indicate time windows of the N2 (230–330 ms), P3a (350–550 ms) and P3b (550–900 ms) chosen for the analyses.