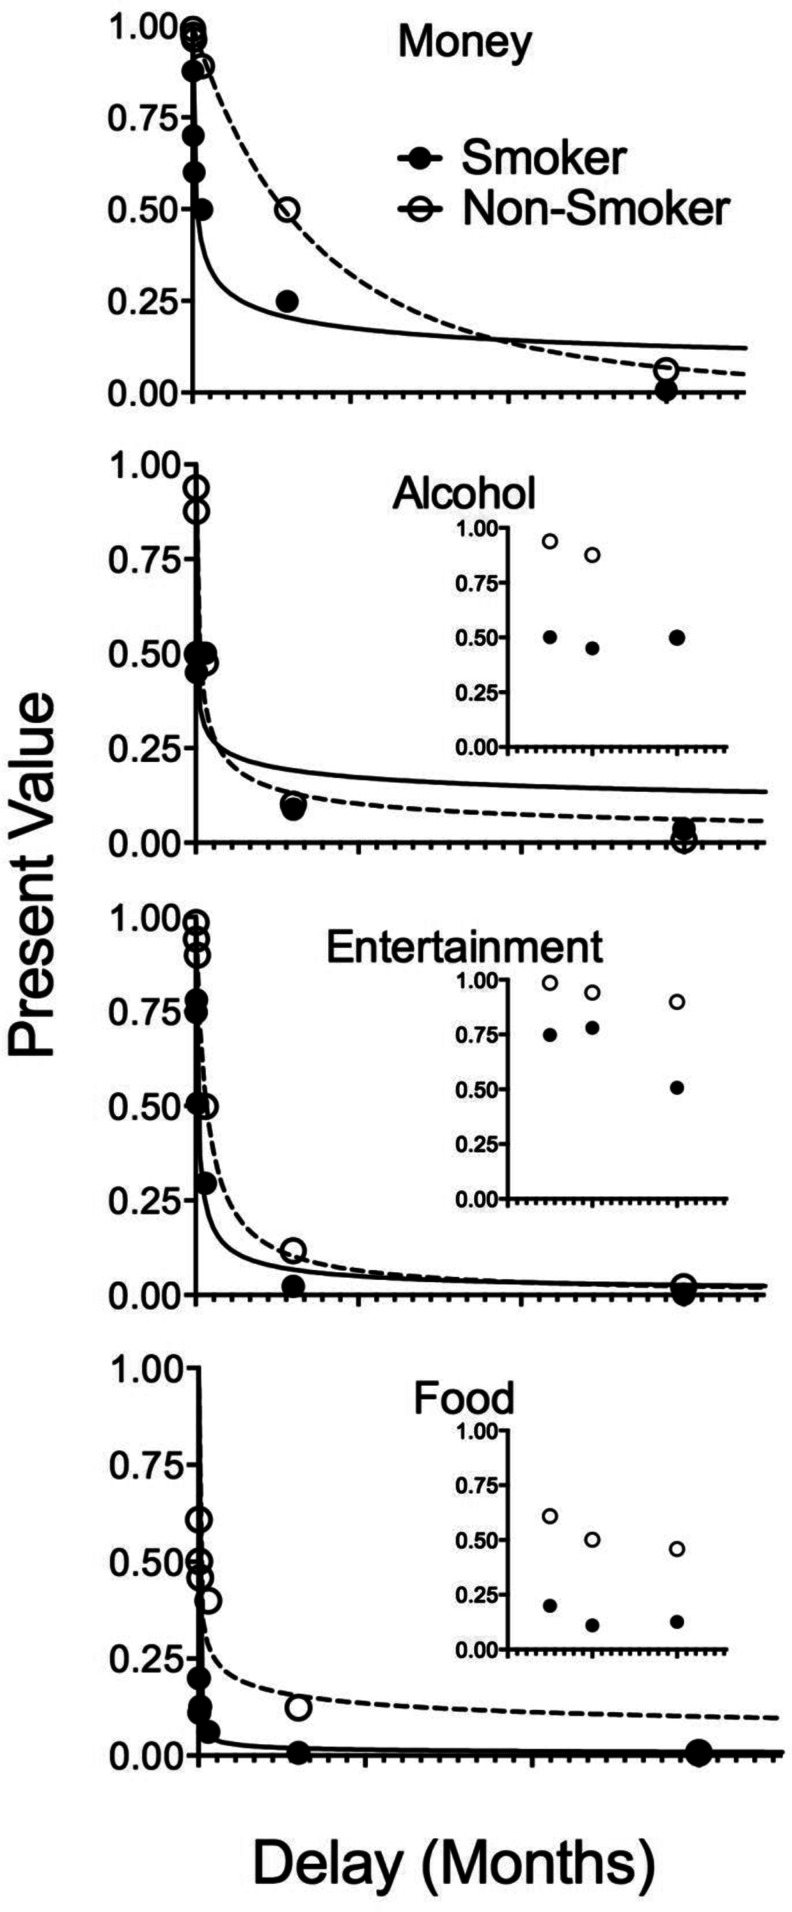
Fig. 1.
Discounting functions for smokers and non-smokers for the commodities of money, alcohol, food, and entertainment. In all four panels, the points show median indifference points and lines show the best fitting hyperbola like discounting function (Myerson and Green 1995). Insets for the commodities of alcohol, entertainment, and food are the same data with the x-axis scaled to show indifference points at the shortest delays. In some cases, data points may overlap

