
Fig. 7.
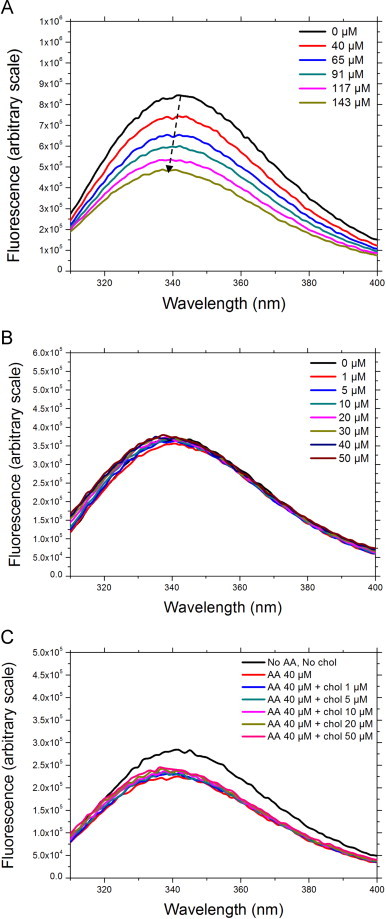
Intrinsic fluorescence of trimera treated with either AA or cholesterol or both. The emission spectra were measured using an excitation wavelength of 290 nm as described in Materials and methods. Results are representative of at least three independent experiments. A: trimera 60 nM, AA as stated in the figure legend. B: trimera 60 nM, cholesterol as stated in the figure legend. C: trimera 60 nM, AA 40 µM, cholesterol as stated in the figure legend.