Figure 4.

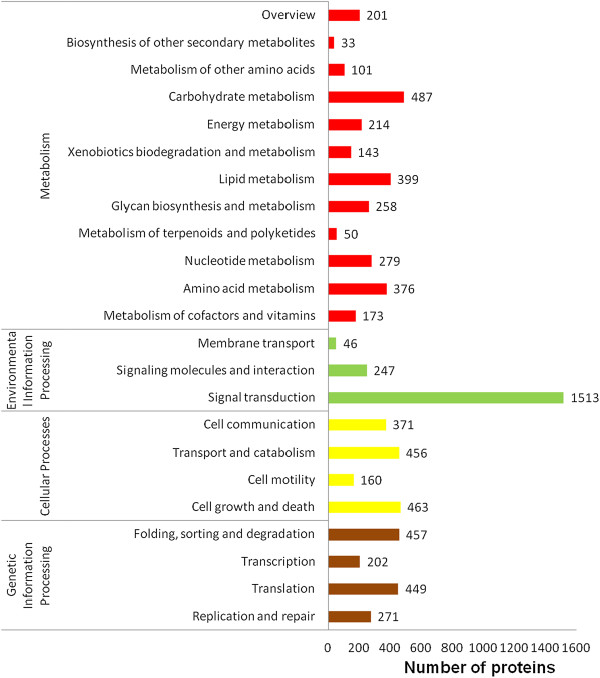
KEGG classification of the P. promelas transcriptome. The x-axis indicates the number of predicted proteins and the y-axis indicates the pathway.

KEGG classification of the P. promelas transcriptome. The x-axis indicates the number of predicted proteins and the y-axis indicates the pathway.