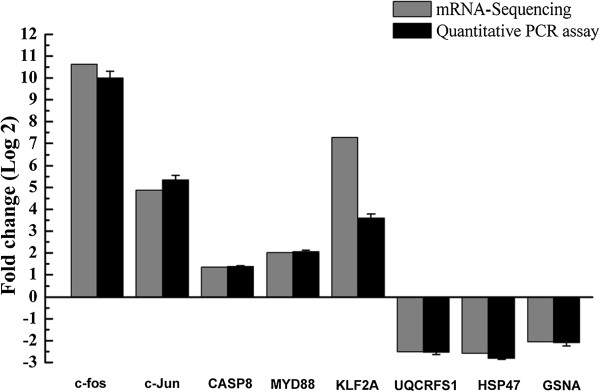
Figure 8.

RT-qPCR confirmation of the differentially expressed genes (DEGs) upon SVCV infection. Relative transcript levels (fold changes) of selected DEGs were determined by the real-time PCR, using TATA box binding protein (TBP) as the reference control, and shown by the black bars. Data shown are the mean of triplicates ± SD. Three parallel experiments were performed and one representative experiment of three is shown. The transcript abundance from DEG data is shown by the grey bars. The minus value means the gene is down-regulated after SVCV infection; while the positive value means the gene is up-regulated in SVCV-infected cells.
