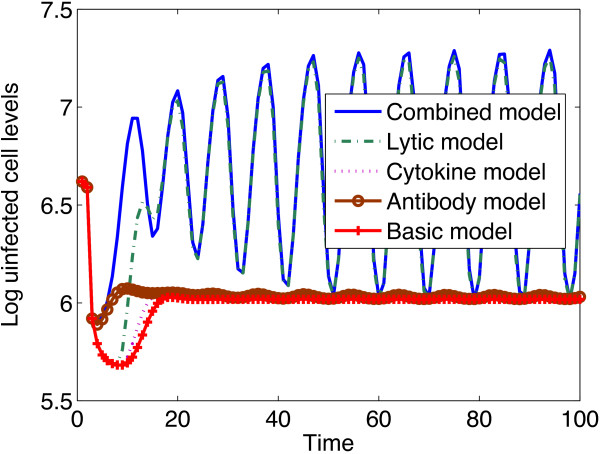
Figure 2.

Plots of uninfected CD4
+
T cell levels against time under different immune response models. All immune response models predict increased uninfected CD4 + T cell levels, with the highest increase predicted from the combined model. Cytokines and chemokines are inefficient in maintaining high uninfected cell levels. The graphs of the cytokine and chemokine models are shown to settle to values close to those of the basic model. The parameter values used are given in Table 1 and the initial conditions were  .
.
