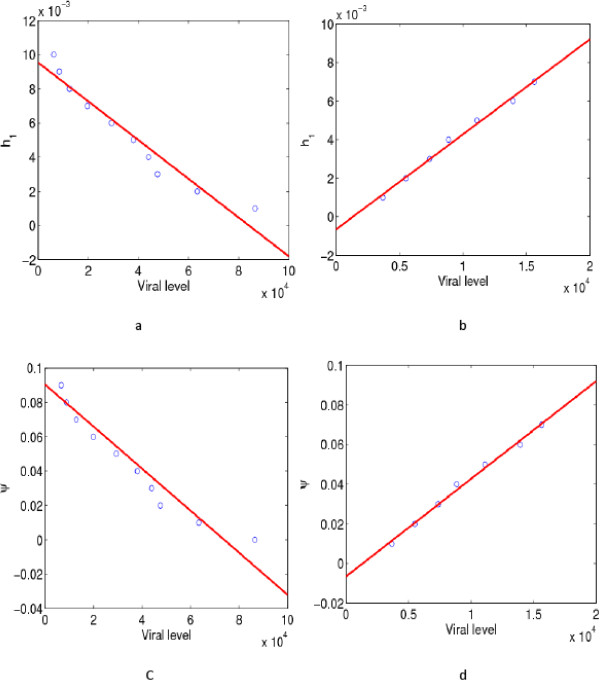
Figure 6.

Scatter plots with model fits between the viral levels and immune response parameters.
a and b give the scatter plots with linear fits between the viral levels and the neutralizing efficiency h
1 of antibodies at time t=10 and t=100, respectively. The circles are the data points and the line is the linear fit. In Figure 6
a, a negative relationship between the viral levels and the antibody neutralizing efficiency is observed. Figure 6
b shows a positive relationship between the viral levels and the neutralizing efficiency. c-d give scatter plots with linear fits (correlations) between the viral levels and the probability of proliferation of B cells ψ, at time t=10 and t=100, respectively. Figure 6
c shows a negative relationship between the viral levels and the probability of proliferation of B cells. In Figure 6
d, a positive relationship between the viral levels and the probability of proliferation of B cells is observed. The parameter values used are given in Table 1 and the initial conditions were  .
.
