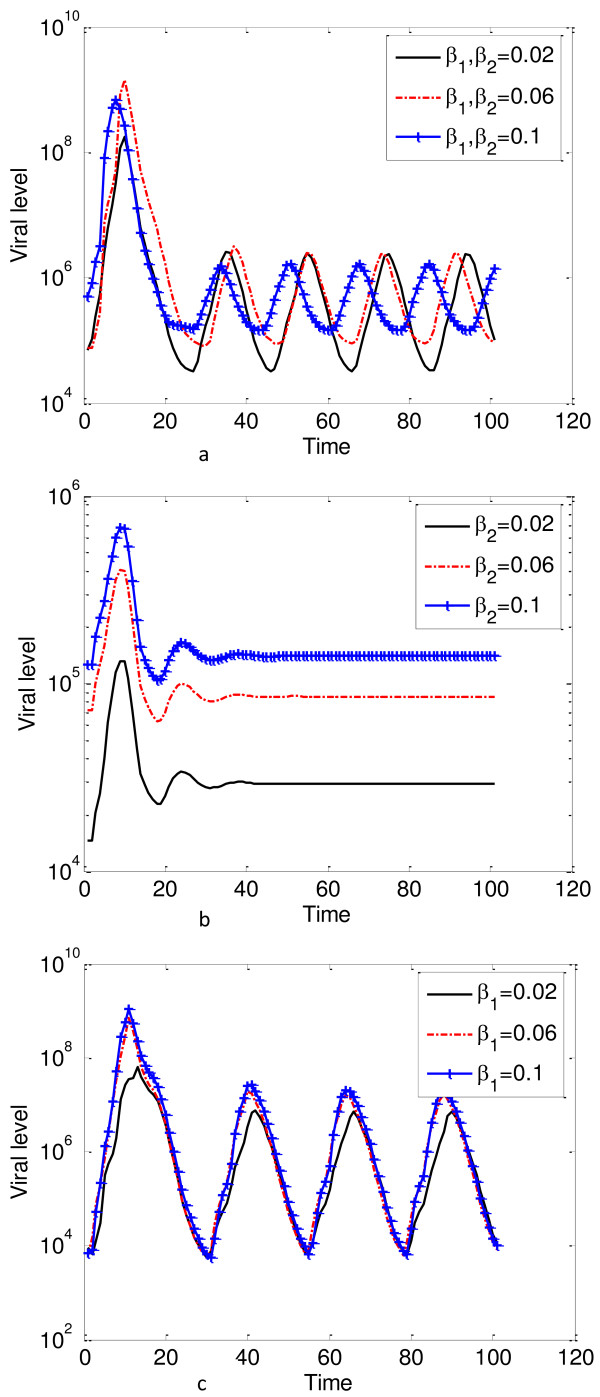
Figure 8.

Effects of the transmission parameters on viral levels. The plots gives natural log of the viral levels against time. a gives the plots for viral levels when β 1 and β 2 are varied simultaneously, b gives the plots for viral levels when β 2 is varied and c gives the plots for viral levels when β 1 is varied. The viral level increases with increases in β 1 and β 2, however, increasing β 2 had a greater impact on viral levels when compared to increases β 1. The viral levels are more sensitive to β 2 than β 1.
