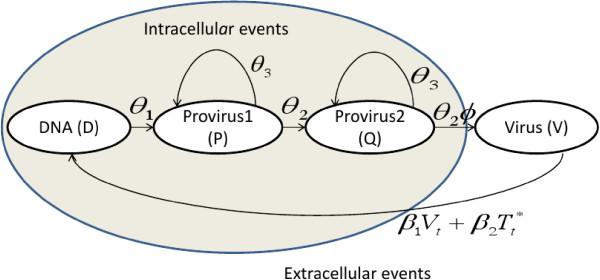
Figure 9.

The life cycle graph for HIV showing the intracellular and the extracellular stages of the virus life cycle. The provirus stage P, has been broken down into two pseudo stages, P and Q. The provirus stage duration distribution is approximated by a Negative Binomial Distribution.
