
Figure 2.
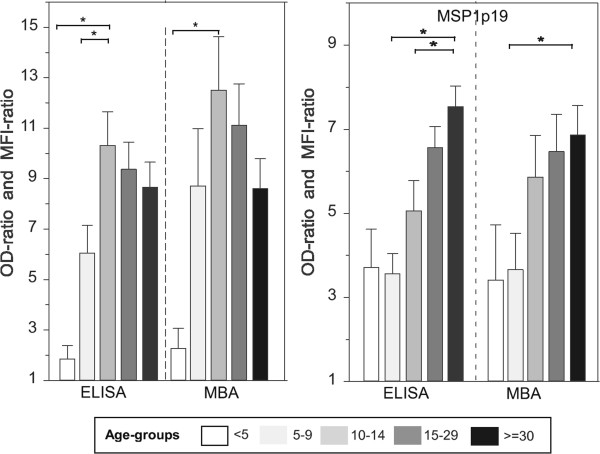
Level of IgG responses to PF13 and PfMSP1p19 measured by individual ELISA and duplex MBA. OD- and MFI-ratios of IgG responses to PF13 and MSP1p19 are plotted as histograms (mean + SE). Antibody responses were stratified according to five age groups (<5, 5–9, 10–14, 15–29 and >30 years; symbols used range from empty, pale grey, light grey, dark grey and black, respectively). Brackets and asterisk indicate significant differences (P <0.05) between levels of antibody responses in different age groups.