
Figure 3.
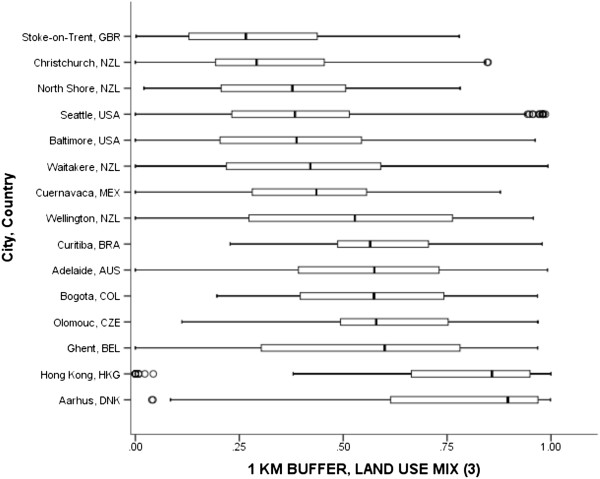
Land use mix between residential, retail combined, and civic/institutional for participants’ 1-km network buffers across cities and countries. Circles are outliers that extend past the whiskers and asterisks represent extreme outliers defined as values greater than three times the length of the interquartile range.