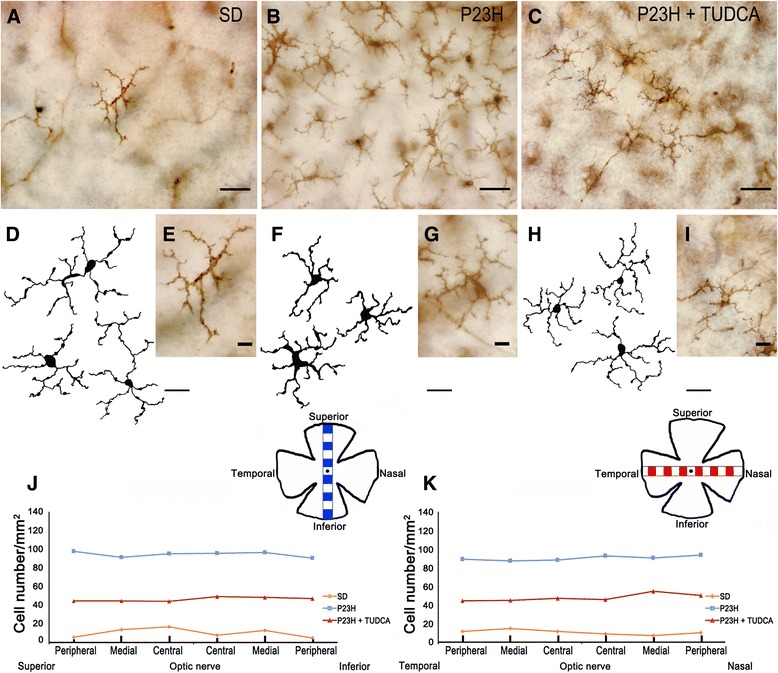
Figure 8.

Morphology, number and distribution of microglial cells in the outer plexiform layer (OPL). (A- C) Representative images of whole-mount rat retinas from a SD (A), untreated P23H (B) and tauroursodeoxycholic acid (TUDCA)-treated P23H rat (C) labeled with immunoperoxidase. (E, G, I) Magnifications of (A), (B) and (C), respectively. (D, F, H) Drawings of microglial cells from SD (D), untreated P23H (F) and TUDCA-treated P23H rat (H). (J, K) Microglial density, expressed as number of cells per mm2, in each of 12 representative regions in each retina: 6 equidistantly arranged on the superior-inferior axis of the retina (J) and 6 disposed on the temporal-nasal axis (K). The scheme in the margin of each panel represents the position in the retina of each representative region analyzed. (A, B, C) Scale bar: 40 μm; (D, F, H) scale bar: 20 μm; (E, G, I) scale bar: 10 μm.
