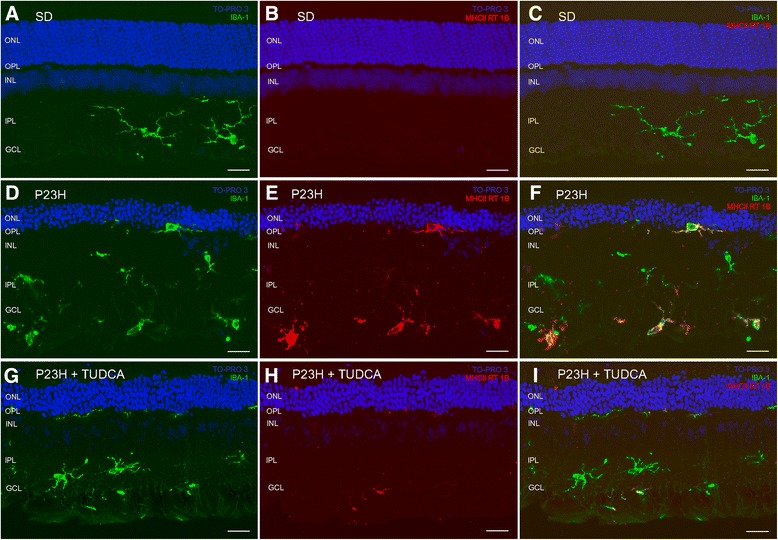
Figure 9.

Activation of microglial cells. Vertical section of retinas from a SD (A- C), untreated P23H (D- F) and tauroursodeoxycholic acid (TUDCA)-treated P23H (G- I) rat stained for Iba1 (green; A, D, G) MHC-II RT 1B (red; B, E, H) or both (C, F, I). Nuclei stained with a nuclear marker (TO-PRO 3, blue). All images were collected from the central area of the retina, close to the optic nerve. GCL, ganglion cell layer; IPL, inner plexiform layer; INL, inner nuclear layer; OPL, outer plexiform layer; ONL, outer nuclear layer. Scale bar: 20 μm.
