
Figure 1. Morphological and physiological characteristics of astrocytes in cultured hippocampal slices.
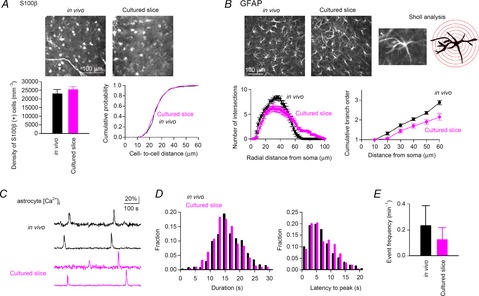
A, (top) immunolabeling of S100β in astrocytes in the striatum radiatum. The sections prepared by transcardial fixation are labelled in vivo. (bottom) Density of S100β-positive cells (left; P > 0.05, Student's t test, n = 4 slices each) and distribution of the cell-to-cell distances between the closest pairs of S100β-positive cells (right; P > 0.05, Kolmogorov–Smirnov test, in vivo, n = 396 cells; cultured slice, n = 435 cells). B, (top) immunolabelling of GFAP in astrocytes. An example cell used for Sholl analysis is magnified in the right panel. The red circles are depicted with diameters that increase in 10 μm intervals. (bottom) Sholl analysis of GFAP-positive processes (left; n = 25 cells each) and the cumulative branch order number plotted as a function of the path length from the soma (right). C, calcium fluorescence traces of rat astrocytes in vivo and in cultured slices. D, distribution of duration and latency to peak of the calcium events of astrocytes (in vivo, n = 533 events from six animals; cultured slice, n = 250 events from seven slices). E, average frequency of astrocyte calcium events (in vivo, n = 119 active cells from six animals; cultured slice, n = 98 active cells from seven slices). Error bars are SEM.