
Figure 3. Characterization of synchronized neuronal activity in cultured hippocampal slices.
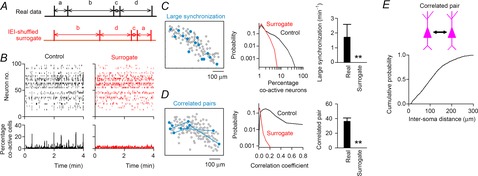
A, to collate the event correlations between neurons, the inter-event intervals (IEIs) were transposed at random within cells. B, a rastergram of 100 neurons (left) was IEI shuffled (right). The bottom time histograms show the percentage of co-active neurons relative to the total number of imaged neurons (100 ms bin). C, cells activated during a representative large synchronization event are shown by filled circles in the left cell map. The distribution of the percentage of co-active cells during a time window of the 100 ms bin (middle) and the frequency of large synchronization (right) are compared with those in the corresponding surrogates (n = 65,908 bins from six slices). D, highly correlated neuron pairs, which exhibited correlation coefficients of more than 0.25, are linked by lines in the left cell map. The distribution of correlation values between all possible neuron pairs (middle) and the number of highly correlated neuron pairs (right) are compared with those in the corresponding surrogates (n = 8339 pairs from 303 neurons). Error bars are SEM, **P < 0.001, paired t test. E, cumulative distribution of soma-to-soma distances between correlated neuron pairs (n = 246 pairs).