
Figure 4. Correlated activity of neuronal and glial networks.
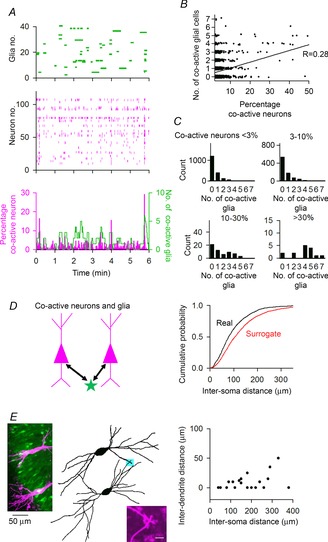
A, calcium activity of astrocytes (top) and neurons (middle). The bottom time histogram represents the percentage of co-active neurons and the number of co-active glial cells. B, the number of co-active glial cells plotted against the percentage of co-active neurons (R = 0.28, P < 0.01, n = 2741). C, distribution of the number of co-active glial cells at the period when the percentage of co-active neurons is <3% (n = 1825), 3–10% (n = 843), 10–30% (n = 58) and >30% (n = 15). The data were reconstructed from the plot in B. D, cumulative distribution of soma-to-soma distances between co-active neurons and glial cells. Surrogate datasets were created by randomly selecting glial cells in the same imaging field. P < 0.01, Kolmogorov –Smirnov test. E, (left) representative image of Alexa 594-injected neurons after whole-cell recordings superimposed on OGB-1-loaded cells. In this example, the inter-soma distance is 168 μm, and the minimum inter-dendrite distance is 0 μm. The point represents a contact site, which is magnified in the right bottom inset. Scale bar = 5 μm. (Right) In each neuron pair, the minimum inter-dendrite distance was plotted as a function of the inter-soma distance (n = 19 neuron pairs).