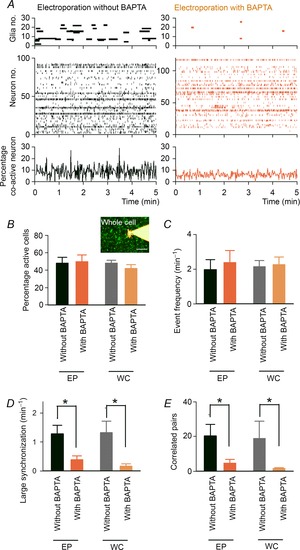
Figure 6. Calcium chelation in astrocytes attenuates neuronal synchronization.

A, the calcium activity of astrocytes (top) and neurons (middle) is compared between slices in which 20 astrocytes were electroporated with BAPTA (right) or no BAPTA (left). The bottom time histograms represent the percentage of co-active neurons (100 ms bin). B and C, the percentage of active neurons in a given 5 min time period (B) and the mean frequency of neuronal events (C). BAPTA was injected by electroporation of astrocyte populations (EP) or whole-cell patching of a single astrocyte (WC, inset). EP Without BAPTA, n = 6 slices; EP With BAPTA, n = 6 slices; WC Without BAPTA, n = 5 slices; WC With BAPTA, n = 5 slices. Scale bar = 50 μm. D and E, the frequency of large synchronization (D) and the number of highly correlated neuron pairs (E). Error bars are SEM, *P < 0.05, Student's t test.
