
Figure 7. Pharmacological inhibition of synchronized neuronal activity.
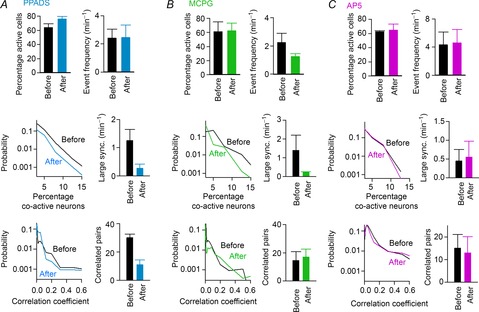
A, (top) the percentage of active neurons in a given 5 min time period and the average frequency of neuronal events before and after bath application of PPADS (n = 4 slices). (middle) Distribution of the percentage of co-active cells (left) and the frequency of large synchronization (right), which were calculated as described in Fig. 3C. (bottom) Distribution of correlation values between neuron pairs (left) and the number of highly correlated pairs (right), which were calculated as described in Fig. 3D. B, same as in A but for MCPG application (n = 4 slices). C, same as in A but for AP5 application (n = 4 slices). Error bars are SEM.