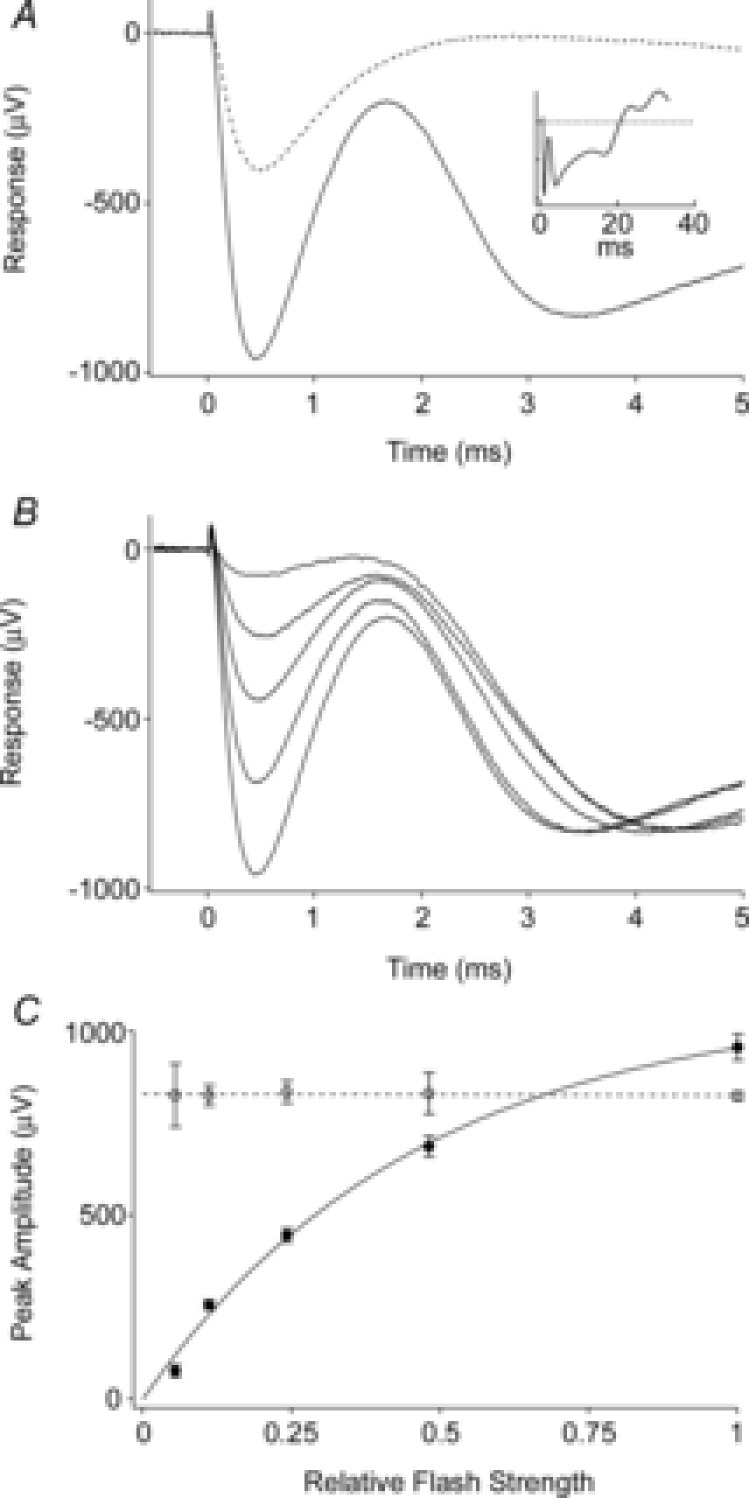
Figure 2. Properties of the mouse ERP.

A, average ERG recorded in response to the first (continuous trace) and the second (dashed trace) of a pair of unattenuated flashes delivered 100 ms apart through the liquid light guide. The initial corneal-negative deflection, complete in ∼2 ms, is the ERP; it is followed in the first response by the corneal-negative a-wave, which does not recover between flashes. The amplitude of the second ERP is smaller, consistent with the first flash bleaching a significant fraction of the underlying pigment. Inset shows the first response on a longer time base. Each trace is the average from 5 experiments. B, average responses to first flashes that were attenuated incrementally by factors of ∼2. The initial ERP amplitudes varied with flash strength, while the a-wave amplitudes did not. Each trace is the average of 2–5 responses from separate experiments. C, initial ERP amplitude varied with flash strength. Average peak amplitudes of the ERP (filled circles) and a-waves (open circles) derived from the experiments of B. Each point is the mean ± SEM. (Phenylephrine was used in these experiments.)
