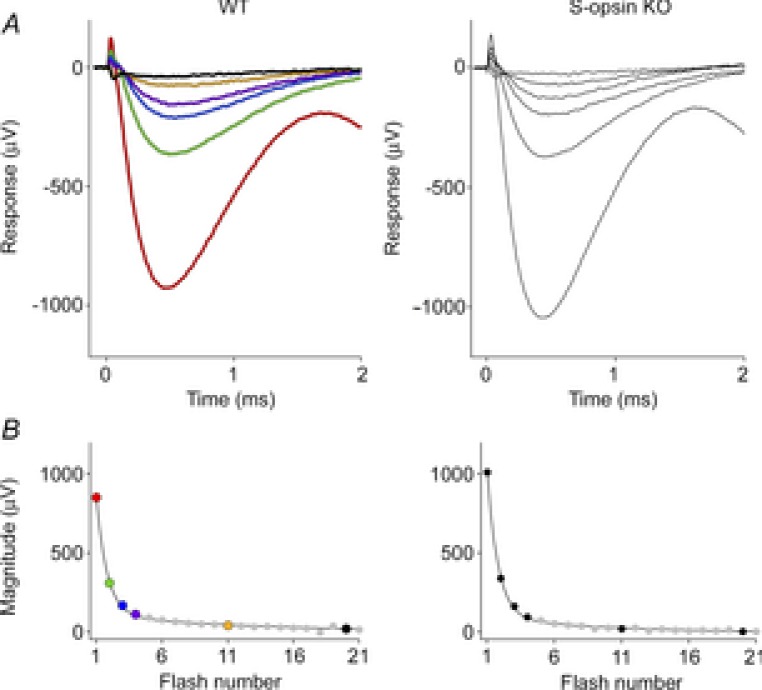
Figure 3. ERP serial bleaching of wild-type mice, and mice lacking cone S-opsin.

A, the two upper panels show the first 2 ms of ERGs obtained in response to the first six of a series of unattenuated flashes delivered through the liquid light guide at 30 Hz. Both WT and S-opsin knockout (KO) data are averaged traces (n = 5 and 3, respectively). The amplitudes of the ERPs in response to the first flash were 924 ± 30 and 1042 ± 28 μV (mean ± SEM, P < 0.005), and 809 ± 27 and 813 ± 22 μV for the initial a-waves of the WT and the S-opsin KO, respectively. B, the lower panels plot the amplitude of the ERP as a function of the number of the flash in the series. The parameters of the best-fitting double-geometric depletion model (eqn (5)) are as follows: for the WT, A = 0.87, PA = 0.70, PB = 0.07; for the S-opsin KO, A = 0.90, PA = 0.71, PB = 0.11.
