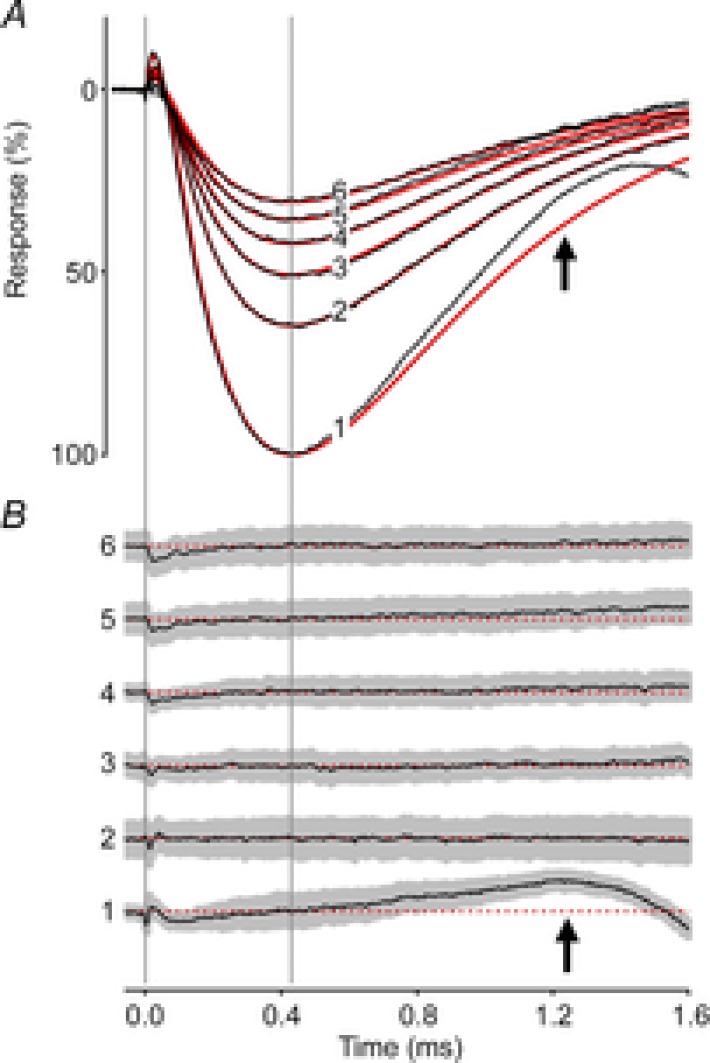
Figure 4. Invariant kinetics of the mouse ERP.

A, the first 6 ERPs from a series of unattenuated flashes (30 Hz), averaged over 160 experiments (black traces). The red traces are the best-fitting version of a theoretical model (Hodgkin & O'Bryan, 1977; Methods, eqn (2)) with parameter values τR1 = 46 μs, τR2 = 215 μs and τm = 570 μs. B, residual differences between the data and theory traces in A plotted along with the 95% confidence interval (grey region). The difference traces have been arbitrarily offset vertically from one another, but are plotted at the same scale as in A, and are identified at left with the corresponding numbers. The dashed red lines indicate the zero difference levels. A single set of kinetics parameters fitted the sequential responses well; the deviation of the initial ERP from the model (black arrows) is consistent with a shorter membrane time constant governing the ERP response to the first flash (see text).
