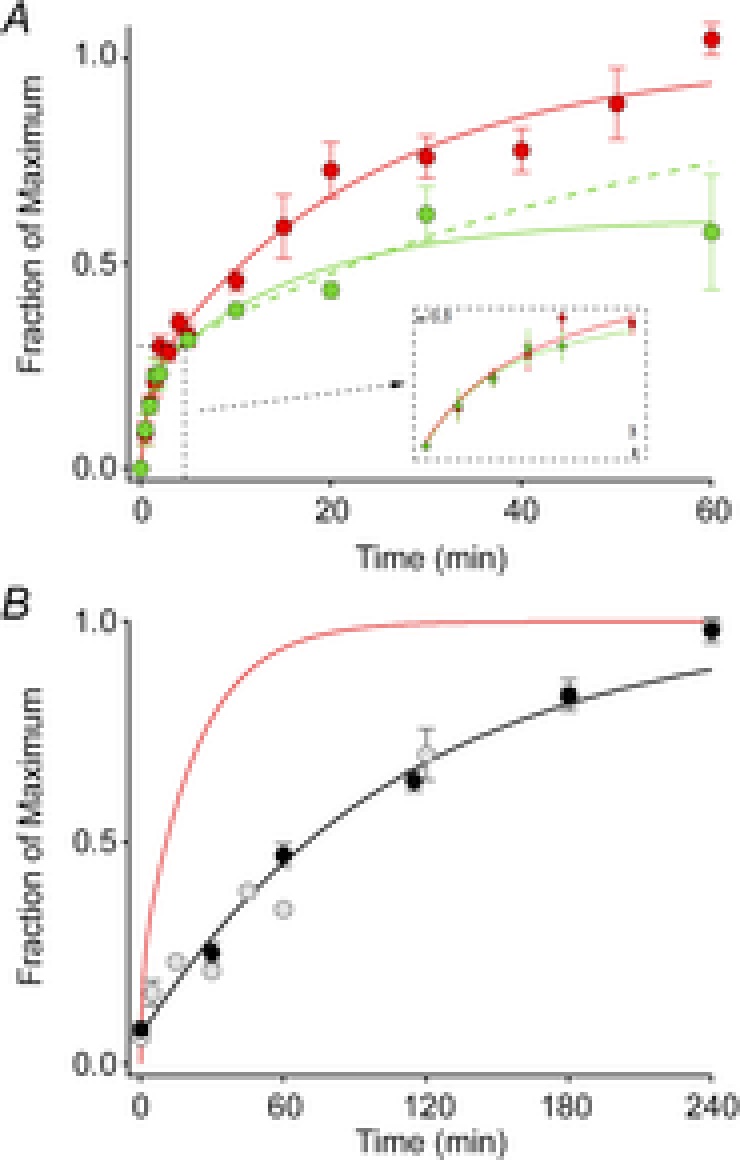
Figure 5. Time course of recovery of the ERP after a full bleach.

A, ERP recovery. Each point represents the mean (± SEM) maximal ERP amplitude following a full bleach (600 unattenuated flashes, 30 Hz) and variable periods of dark adaptation. The red filled circles plot the data of WT mice (n = 6–13), while the green filled circles show the data of Rpe65+/− mice (n = 3–5). The continuous curves fitted to the data are double-exponential rises (eqn (4), Methods) with C1 = 0.21, τ1 = 0.94 and τ2 = 23.3 min for the data of WT mice, and C1 = 0.21, τ1 = 0.84 min and τ2 = 16.4 min for those of the Rpe65+/− mice. The recovery of the Rpe65+/− mice achieved only 61% recovery at 60 min, and the precise time course of the recovery, while clearly slowed, is poorly determined. Assuming (as established by experiments on subsequent days) full recovery, we forced the regeneration to asymptote to unity, yielding the dashed green curve, with parameters C1 = 0.25, τ1 = 0.84 min and τ2 = 56 min. The inset shows the initial 3 min of recovery on an expanded time base. B, comparison of the ERP recovery (red trace, copied from A) with the regeneration of total rhodopsin of C57Bl/6 mice after a full bleach, replotted from two independent studies (pale symbols, Wenzel et al. 2001; black symbols and rate-limited regeneration time course from Lyubarsky et al. 2005). For the a-wave recoveries the same initial bleach protocol was used as in Fig. 3 (600 flashes, 30 Hz), but the subsequent test flash was attenuated 16-fold (ND = 1.2), and delivered every 2 min; flashes of this strength saturated the a-wave amplitude in the dark-adapted mouse. (All experiments in this figure were done with flashes delivered by the glass fibre optic light guide.)
