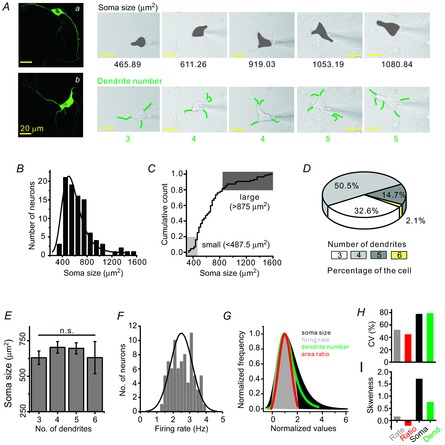
Figure 1. Morphological diversity of midbrain DA neurons.

A, isolated midbrain neurons were identified as DA neurons by immunocytochemistry: fluorescence images of TH antibodypositive neurons (a and b). The diversity of soma size and dendrite numbers in the isolated DA neurons: DA neurons show different sizes of the soma (grey areas) and different numbers of dendrites (green lines). B, histogram and distribution curve of soma size in isolated DA neurons (bin size = 100 μm2, n = 92). C, cumulative count of soma size. D, pie chart showing the percentage distribution of neurons. E, no correlation between the number of primary dendrites and soma size of DA neurons (n = 89). F, normal Gaussian distribution of SFR (n = 79). Bin size is 0.2 Hz in the histogram (minimum frequency = 1.2 Hz, maximum frequency = 3.8 Hz). G, comparison between the normalized distribution curves of soma size (black), SFR (grey), dendrite number (green) and proximal dendritic compartment/soma area ratio (red). H, SFR (51.2%) and the area ratio of proximal dendrites to the soma (44%) show less variability than do the distributions of soma size (76.8%) and numbers of dendrites (78.2%). I, skewness coefficient also differed with firing rate (0.14), area ratio (−0.19), soma size (1.7) and the number of dendrites (0.74).
