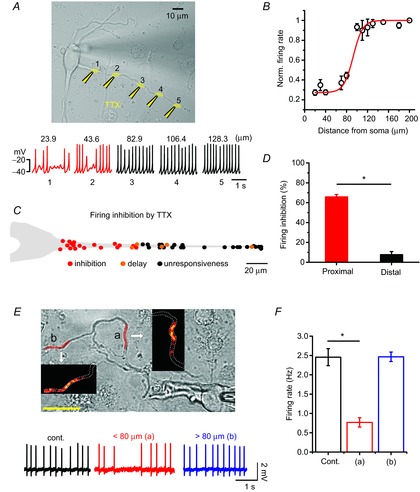
Figure 4. Importance of the proximal dendritic compartment for determining SFR in DA neurons.

Spontaneous firing activity was perturbed by local application of TTX or Ca2+ uncaging in the isolated DA neurons. A, transmitted light image of a DA neuron and TTX puff sites (1 μm, yellow) and the recorded firing activities are shown at the time of TTX application at the marked site of a dendrite. B, the relationship between normalized firing rates and TTX puff locations along a dendrite (each point from 1–6 trials, n = 8). C, simplified SFR inhibition map along a dendrite. The red, orange and black circles indicate clear firing inhibitions (skip of more than one spontaneous firing or delay of spontaneous firing rate more than 50%), a delay of spontaneous firing rate by 10∼50% and no inhibition, respectively. D, bar graph of the firing inhibitions by TTX puffs in the proximal and distal dendritic compartments (n = 8; *P = 1.12×10⁻⁷, one-way ANOVA). E, Ca2+ uncaging induced highly localized Ca2+ rises within the uncaged dendritic area as shown in colour intensity graphs in the insets. Each uncaging area is marked by red on the dendrite of a transmitted DA neuron image. Firing traces are recorded at the control (black) and at the time of Ca2+ uncaging over the proximal (a, red, 59.8 μm from soma) and distal (b, blue, 112.4 μm from soma) dendritic compartments. F, bar graph of the SFR changes by Ca2+ uncaging in the proximal and distal dendritic compartments (n = 4; *P = 1.08×10⁻⁴).
