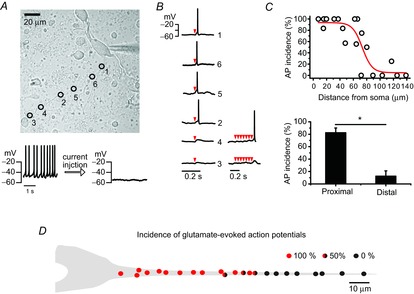
Figure 6. Different excitability between the proximal dendritic compartment and the distal compartment in DA neurons.

AP was generated by localized glutamate uncaging under the silencing of DA neurons with hyperpolarizing currents. A, transmitted light image of a DA neuron marked with uncaging sites and orders (up). Spontaneous firing was suppressed by hyperpolarizing current (10–15 pA) injection. B, AP traces evoked by local MNI-caged glutamate uncaging. Red arrowheads indicate trials of uncaging. C, the relationship between the incidences of glutamate-evoked APs and stimulation locations along a dendrite (up). The proximal dendritic compartment shows higher AP incidence than the distal dendritic compartment (n = 12, *P = 4.27×10⁻⁵). D, a simplified figure of AP incidence distributions along a dendrite. Incidence percentages are calculated from the number of AP generation successes/the number of total trials (4–6). The red or black closed circles indicate that all trials generated APs or failed to generate APs, respectively. The circles filled by red, black and half-and-half indicate 100, 0 and 50% incidence of APs, respectively.
