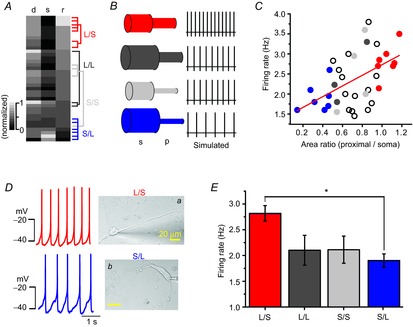
Figure 8. The ratios of proximal dendritic area to soma area determine intrinsic excitability of DA neurons.

A, heat map graph showing the wide variety of areas of the proximal dendrites, soma sizes and the area ratio of proximal dendrites to soma. All values are normalized. Neurons were allocated to four groups. B, simplified neuron models and simulated spontaneous firing of each model. Model neurons are classified according to soma size and the area of proximal dendrites. C, SFR increases with the area ratio of the proximal dendrites to the soma. The red closed circles indicate a neuron that has a large proximal dendritic area and small soma, and the blue closed circles indicate a neuron that has a low area ratio of small proximal compartments to large soma (n = 37). D, transmitted light images of representative types of neurons in different groups and corresponding firing traces: a, large proximal dendrites and small soma (L/S); b, small proximal dendrites and large soma (S/L). E, comparison of SFRs in different groups of DA neurons (n = 37, *P = 0.04).
