
Figure 1.
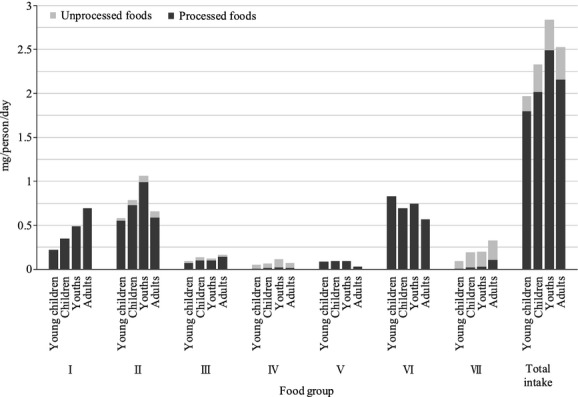
Total daily Al intake. The graph indicates the estimated daily intake of Al from each food category. Al intake from processed foods is indicated in black, and Al intake from unprocessed foods is indicated in gray.
Official websites use .gov
A
.gov website belongs to an official
government organization in the United States.
Secure .gov websites use HTTPS
A lock (
) or https:// means you've safely
connected to the .gov website. Share sensitive
information only on official, secure websites.
Total daily Al intake. The graph indicates the estimated daily intake of Al from each food category. Al intake from processed foods is indicated in black, and Al intake from unprocessed foods is indicated in gray.