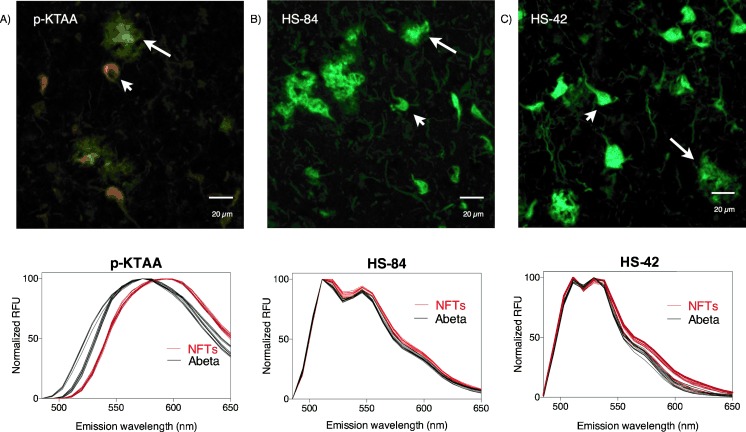
Figure 4.

Fluorescence images and emission spectra of: A) p-KTAA, B) HS-84, and C) HS-42 bound to two histopathological hallmarks of AD (Aβ plaques and NFTs) in human brain tissue. The emission spectra of the indicated ligand bound to Aβ plaques or NFTs when excited at 488 nm. The images show the typical pathological protein entities of AD, Aβ plaques (white arrows) and NFTs (white arrow heads), from which the emission spectra were obtained. Scale bars represent 20 μm.
