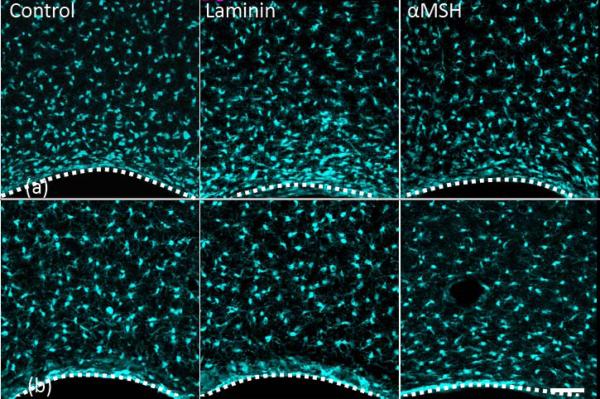
Figure 3.
Projected confocal images of Iba-1 positive cells (microglia) response to implanted A-CNEs (control, laminin, and α-SMH). (a) one week after insertion. (b) four weeks after insertion. A dotted white line illustrates the A-CNE (in black)-tissue interface (laminin and α-SMH at 4 weeks) are blood vessels Scale bar 50 μm.

