
Figure 2.
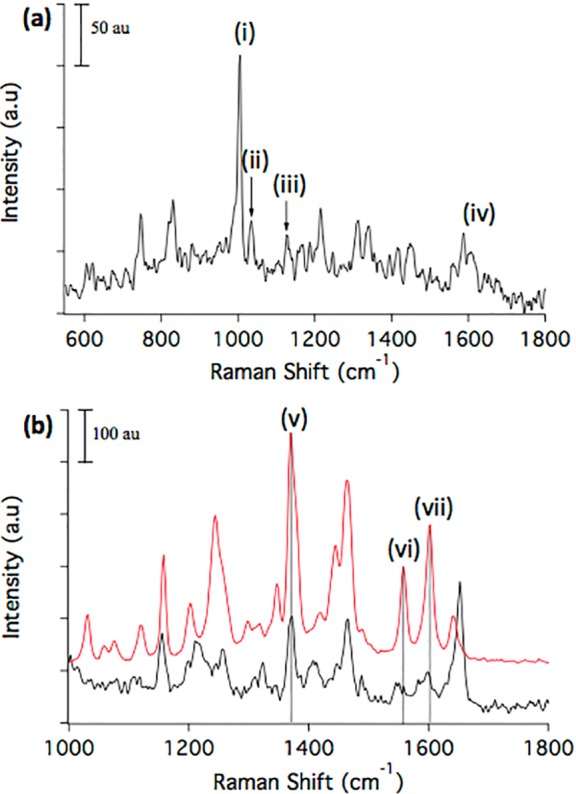
CRM spectral profiles of P. aeruginosa biofilm. (a) CRM profiling of a P. aeruginosa biofilm detects multiple biomolecular classes by characteristic vibrations, including (i) 1005 cm–1 from symmetric ring-breathing vibrations of phenylalanine and tryptophan (indicating proteins), (ii) 1034 cm–1 from C–O stretching of carbohydrate moieties with contributions from in-plane C–H deformations in phenylalanine, (iii) 1163 cm–1 from C–C and C–O asymmetric ring-breathing vibrations of carbohydrates, and (iv) 1605 cm–1 C=C stretching in phenylalanine. (b) Comparison of a quinolone-rich biofilm ROI (black trace) with a purified commercial PQS standard (red trace) reveals several matching vibrations, including (v) 1371 cm–1 quinolone ring stretch, (vi) C–C and C–N–C associated quinolone ring stretches, and (vii) 1603 cm–1 symmetric C=C stretching in the quinolone ring. Dotted vertical lines are added to facilitate comparison. All Raman spectra are baseline corrected using a fourth order polynomial function.