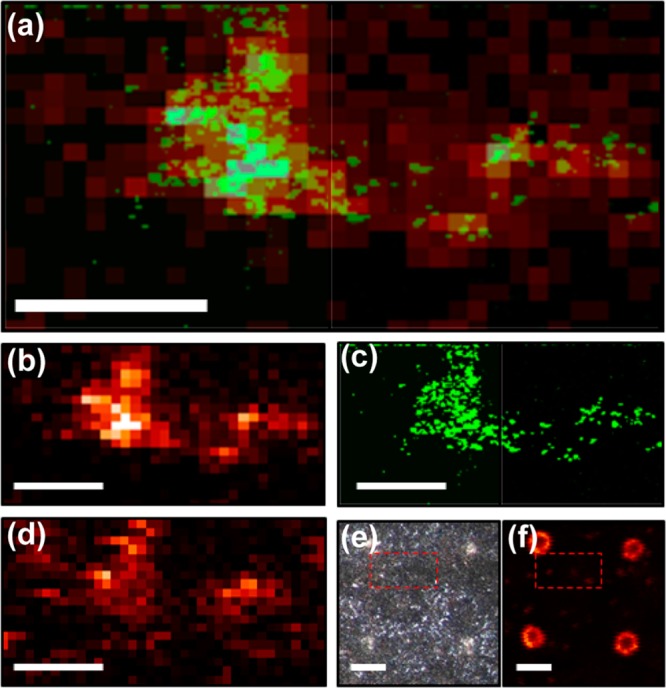
Figure 4.

Correlated SIMS/CRM imaging provides additional information about signaling molecules in P. aeruginosa biofilm. (a) Superimposed CRM “composite quinolone” image (1350–1400 cm–1, quinolone ring stretch) and SIMS 2-heptyl-2-quinolone ion image (HHQ, MH+ at m/z 244.17) shows a similar molecular distribution in the selected ROI. The same images are shown individually for (b) SIMS and (c) CRM, where high spatial resolution enables visualization of micron-scale features within the ROI. (d) Another quinolone, 4-hydroxy-2-nonylquinolone-N-oxide (C9–NQNO, MH+ at m/z 288.20) appears to be colocalized, but the distribution is distinct from that of HHQ within the composite quinolone area. (e) Optical and (f) SIMS ion images (m/z 250.81) with a larger field of view show how the microspot array is visualized around the ROI, allowing precise navigation and image alignment. Red boxes specify the ROI of the CRM/SIMS detail. Scale bars = 100 μm in a–d and 200 μm in e and f.
