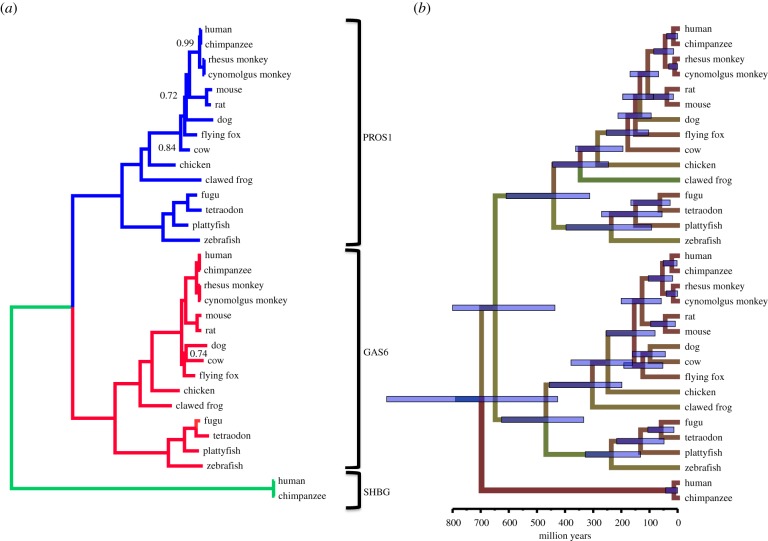
Figure 1.
Phylogenetic consensus tree with and without molecular clock of GAS6, PROS1 and SHBG sequences. (a) Tree without a molecular clock model. The GAS6 clade is coloured in red, the PROS1 clade is in blue and the SHBG clade is in green. Values at the nodes indicate posterior probabilities. Only values different from 1.00 are indicated. The lengths of the axes are proportional to the estimated number of mutations per site. (b) Phylogenetic tree under a relaxed clock model. The tree topology is the same as that of the tree in panel (a). The estimated times of divergence of the more important nodes are indicated in electronic supplementary material, table S1. The blue error bars at the nodes represent the 95% confidence limits.

