
Figure 4.
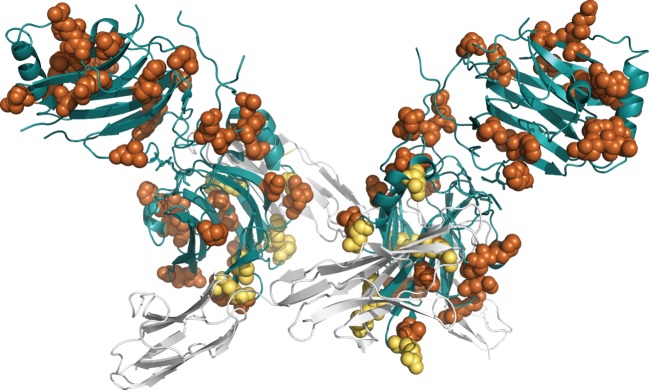
Three-dimensional visualization of GAS6 in complex with Axl (PDB ID: 2C5D). Sites under functional divergence are shown as spheres and coloured in orange. Sites under functional divergence and in contact with Axl (in cartoon and in white) are in yellow. α-helices and β-sheets of GAS6 domain are in blue.