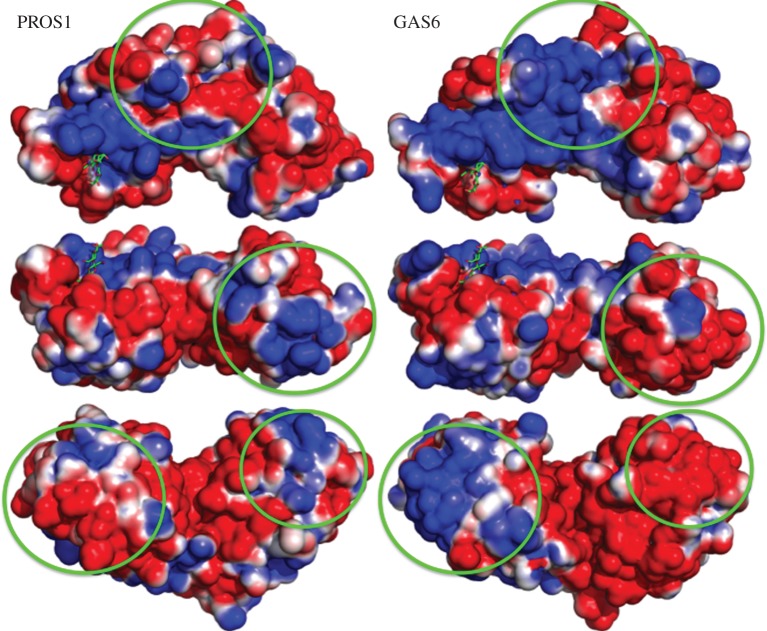
Figure 6.
Visualization of electrostatic surfaces on the SHBG-domain of PROS1 and GAS6. To make the direct comparison between GAS6 and PROS1 easier, we have modelled their SHBG domains using the GAS6 PDB structure (PDB ID: 2C5D). NAG ligand has been added to identify its putative binding pocket. While it is crystallized in GAS6, there is no evidence to indicate whether it can be present in PROS1. Basic surfaces are in blue while acidic surfaces are in red. The NAG ligand is in green. The green circles indicate the observed differences in electrostatic surface potential between GAS6 and PROS1.

