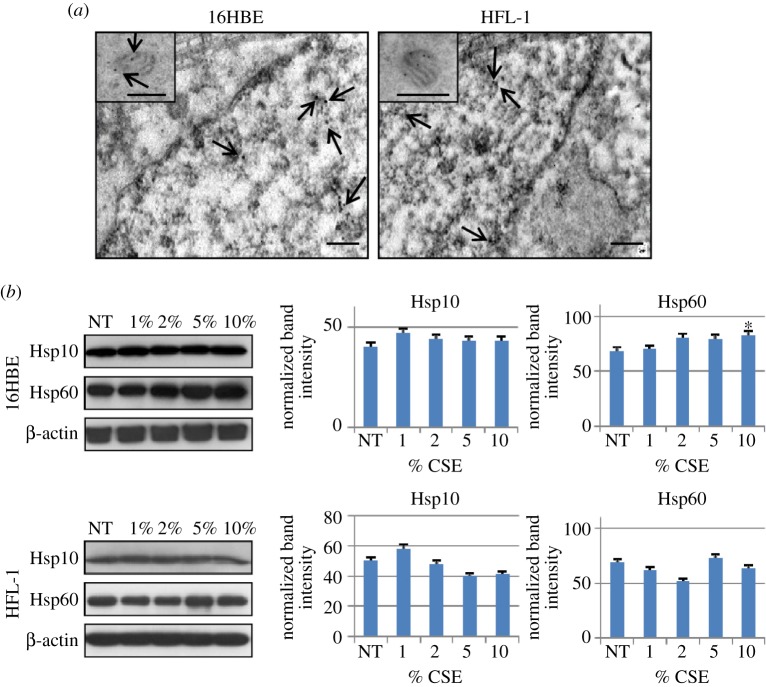
Figure 4.
Localization of Hsp10 by electron microscopy and the immunogold technique and western blotting analyses of Hsp10 and Hsp60 in cell lines. (a) Immunogold for Hsp10 on 16HBE and HFL-1 cells, showing its nuclear localization in addition to its typical presence in mitochondria (insets). Arrows indicate some of the Hsp10 positivity in the nucleus and in mitochondria. (b) Western blotting analyses of total protein extracts from 16HBE and HFL-1 cell lines after treatment with CSE at various concentrations from 1 to 10%, for 24 h, in comparison with NT cells. Statistical analysis was performed using the Mann–Whitney test. Data are represented as mean (±s.e.m.) of three replicate experiments. Only Hsp60 showed a significant increase after 24 h of treatment of 16HBE cells at 10% CSE concentration by comparison with the NT controls (*p < 0.0001). All other variations were not significant, with p-values ranging between 0.1 and 0.7.

