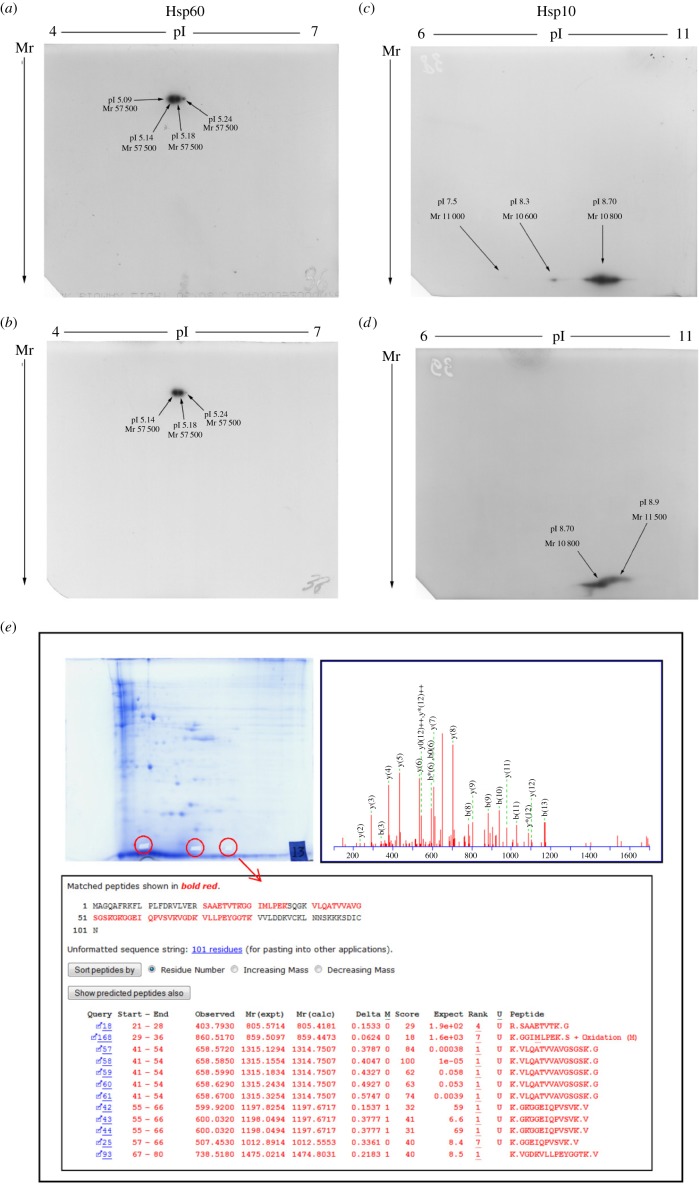
Figure 5.
2D SDS-PAGE and mass spectrometry analyses. 2D SDS-PAGE of Hsp60 (a,b) and Hsp10 (c,d) before (a,c) and after (b,d) treatment of the cells with CSE 5% for 24 h. Both Hsp10 and Hsp60 showed changes in Mr and pI after treatment. (e) Proteomic and mass spectrometry analyses confirmed the identity of the three spots in (c) as isoforms of Hsp10.

