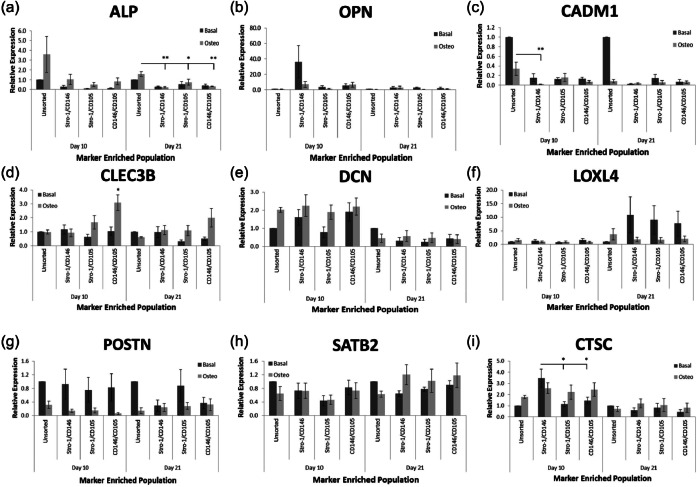
Figure 6.
Gene expression analysis within dual-labelled populations. Cell populations were isolated via FACS from HBMSCs according to Stro-1/CD146, Stro-1/CD105 and CD146/CD105 expression. Unsorted HBMSCs were used as a control. Samples were cultured for 10 and 21 days in either basal or osteogenic media before rtPCR analysis for (a) ALP, (b) OPN, (c) CADM1, (d) CLEC3B, (e) DCN, (f) LOXL4, (g) POSTN and (h) SATB2 expression. (i) The immune regulatory gene, CTSC, was used as a negative control. Error bars are SD (*p ≤ 0.05, **p ≤ 0.01).
MACS: magnetic-activated cell sorting; HBMSC: human bone marrow stromal cell; rtPCR: real-time polymerase chain reaction; SD: standard deviation.

