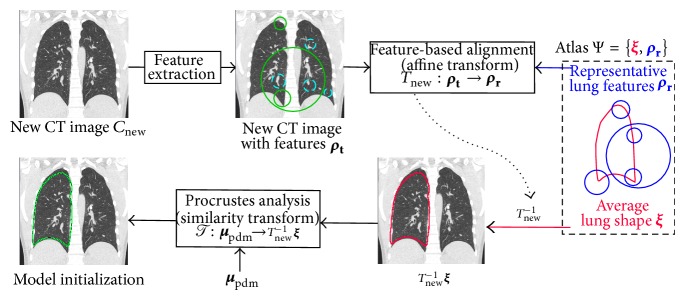
Figure 3.

Schematic diagram showing the model initialization process for a new CT image. Features ρ t are shown superimposed on the coronal slice of a CT image. Features matching with representative lung features ρ r are marked with a solid line while the others are marked with a dashed line. For sake of clarity, the above process is shown only for the right lung.
