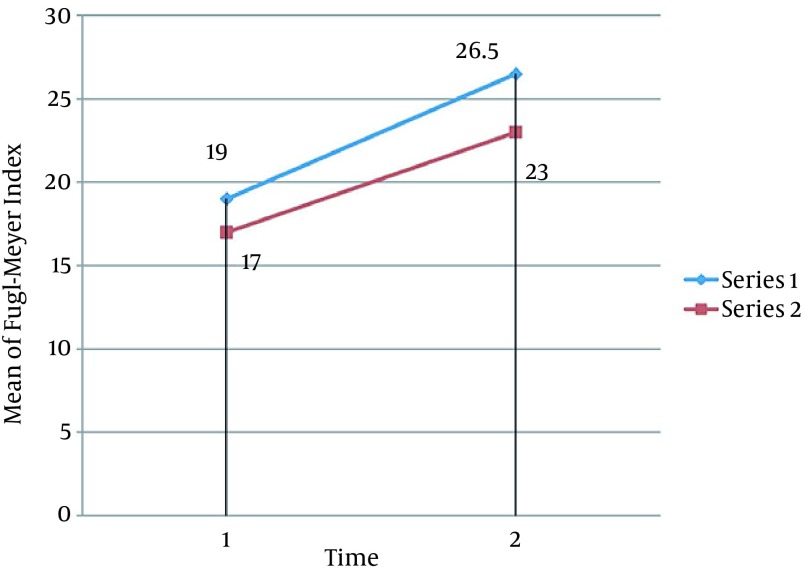
Figure 1. Comparison of Mean of Fugl-Meyer Index Between the Two Groups.
Mean values of three variables increase in both groups during time but in the experimental group this amount increases with the little bigger slope. (Series 1: Experimental Group, Series 2: Control Group. 1: Pre-test, 2: Post-test)

